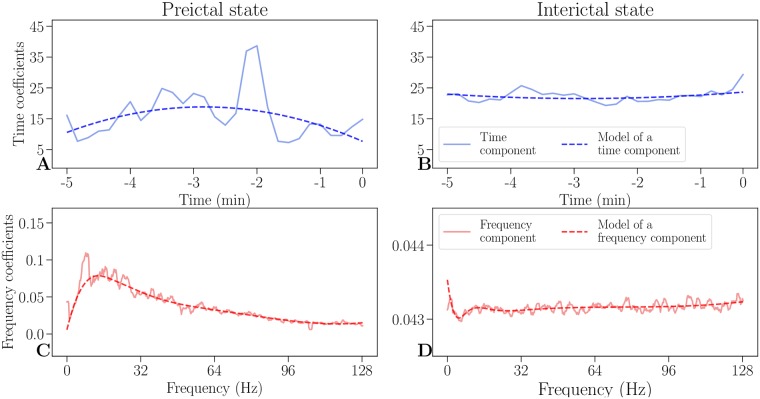
Fig 2. Time and frequency components and its models.
An example of decomposed time (solid blue lines) and frequency components (solid red lines) and their respective models (dashed lines) of a preictal state (A, C), as well as an interictal state (B, D). In a preictal state, the time component (A) increases as a seizure is approaching, while the frequency component (C) has an increase in low frequencies. Both interictal components (B, D) are steady and are an order of magnitude lower than their respective preictal components (A, C).

