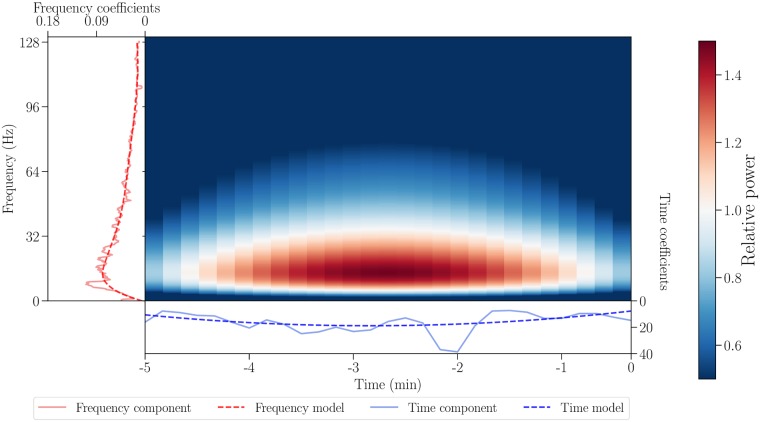
Fig 3. Obtaining a time-frequency model from the respective components.
The NMF components are shown with solid red and blue lines for frequency and time, respectively, while their models are shown with dashed lines. The time-frequency model (center) is an outer product of modeled time and frequency components.

