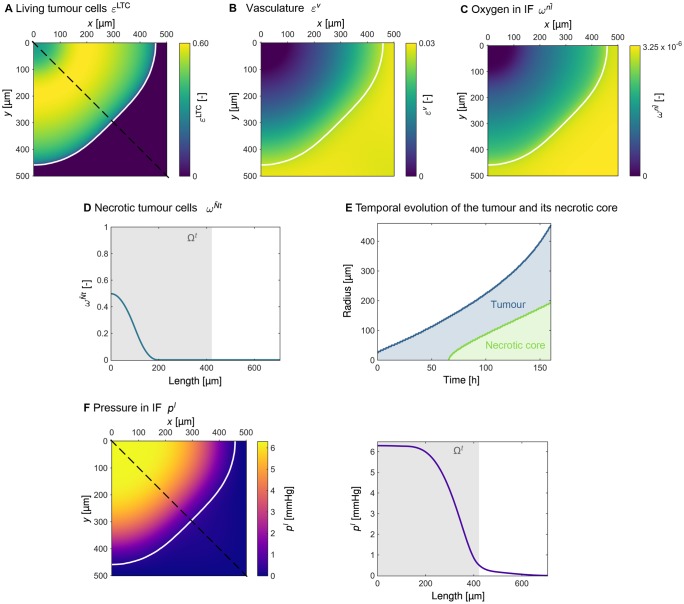
Fig 4. Results of tumour growth after 120 hours.
The white contour line indicates the edge of the tumour defined as St = 0.1. (A) Volume fraction of living tumour cells . (B) Volume fraction of vasculature εv. (C) Mass fraction of oxygen in the interstitial fluid (IF) . (D) Mass fraction of necrotic tumour cells visualised over the cut marked by the dashed line in Fig 4A. (E) Temporal evolution of the radius of the tumour and of its necrotic core. (F) Pressure pl in the IF.

