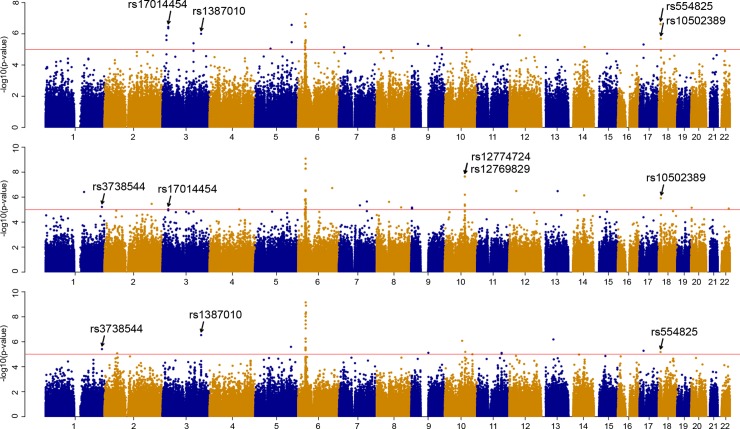
Fig 2. Genome-wide (autosomes 1–22) distribution of p-values for iHS scores in three out of the eight populations studied.
The populations are (from top to bottom): Russians from Mezen, Russians from Ustyuzhna, and Veps. Horizontal red lines indicate P-value threshold applied (P ≤ 1 × 10⁻⁵). Loci of interest are pointed with arrows.

