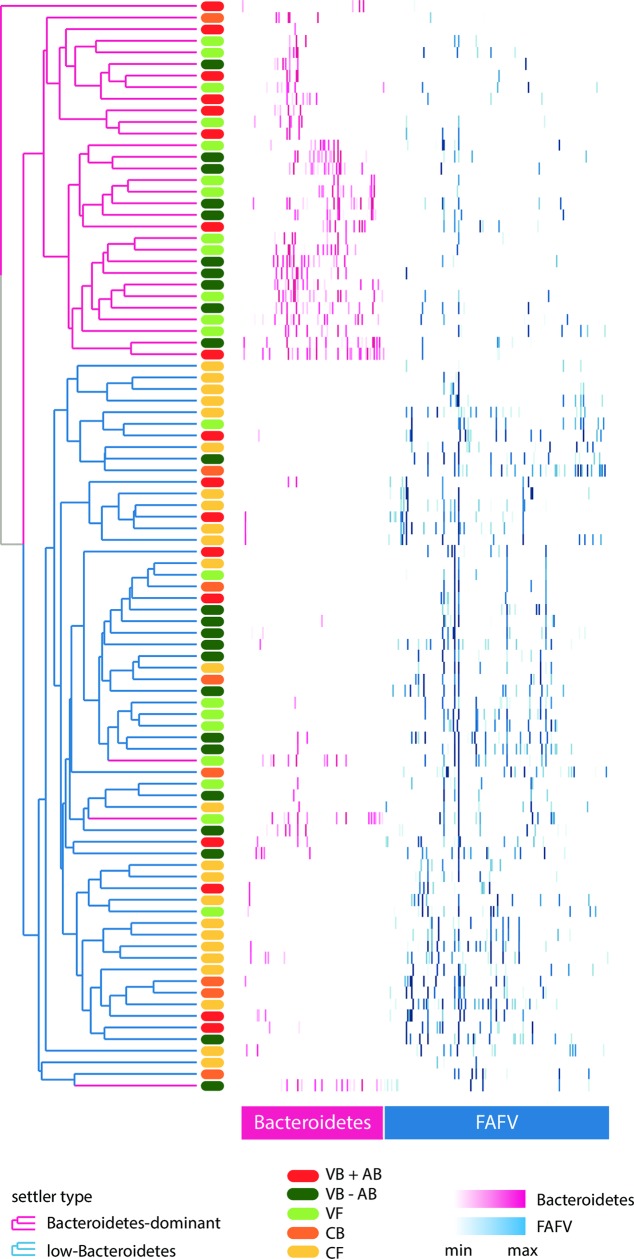
Fig 1. Heat map of all profiles at T = 1 (one week), sorted and colored by phylum.
Abundance of OTUs in each sample at T = 1 (one week). Rows correspond to samples (antibiotic treatment: red; vaginal delivery: green; caesarean section: orange); columns correspond to OTUs. Phyla color shades represent the abundance of each OTU in a sample (Bacteroidetes: pink; FAFV: blue). Cosine correlations and hierarchical clustering were calculated on the raw data, but for a better interpretation we only present the called peaks in this visualization. Top cluster samples (pink) belong to the Bacteroidetes-dominant settler type. Bottom cluster samples (blue) belong to the low-Bacteroidetes settler type (with three exceptions). FAFV = Firmicutes, Actinobacteria, Fusobacteria, Verrucomicrobia; OTU = operational taxonomic units.

