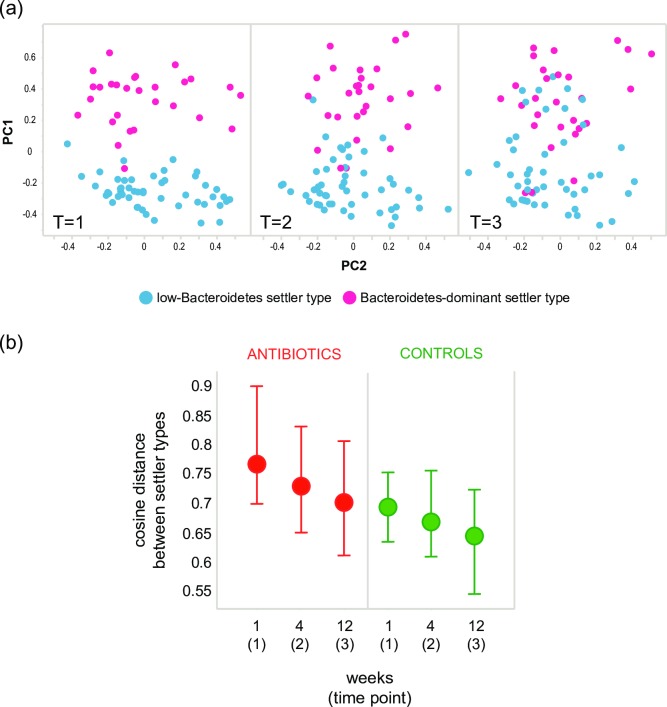
Fig 2. Convergence of settler types over time.
A principle coordinate analysis of intestinal microbiota of all untreated infants at week 1 (T = 1), month 1 (T = 2) and month 3 (T = 3). Samples are colored by settler type. (b) Cosine distances, as a measure of community dissimilarity between settler types, displayed over time by treatment group. Dots indicate median cosine distances, bars indicate IQR (inter quartile range). A higher distance indicates the settler types are less similar.

