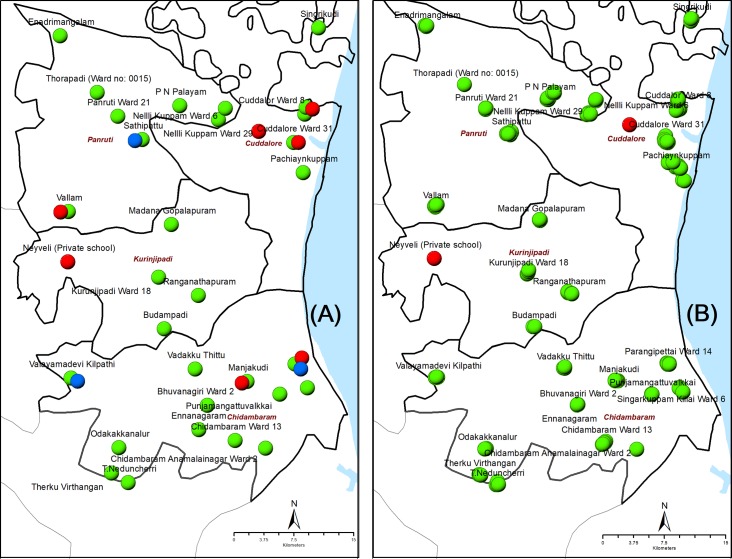
Fig 2. Location of clusters (villages or wards) for mosquito collection and human blood survey in the evaluation unit.
The left panel shows the sites where mosquito and Mf-surveys were carried out (A) and the right-side panel shows the location of schools where the TAS was done (B). Clusters/schools that were negative for filarial infection in both humans and mosquitoes are shown in green, clusters with at least one mosquito pool positive for filarial infection or schools with at least one child positive for filarial antigen are shown in red and clusters with at least one Mf positive individual are shown in blue.

