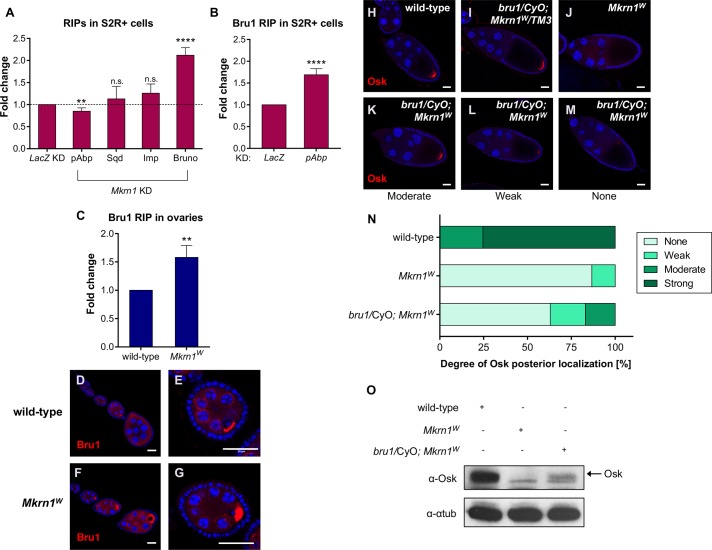
Fig 7. Mkrn1 competes with Bru1 for binding to osk mRNA.
(A) RIP experiments in either control S2R+ cells, or upon knockdown of Mkrn1. Binding of the indicated proteins to the luciferase-osk-3’UTR reporter was monitored by RT-qPCR. The relative fold change in recovered RNA upon Mkrn1 knockdown is illustrated, compared to RIP experiments in LacZ-depleted cells. For every RIP experiment, the enrichment was calculated using GFP. Error bars depict SEM, n ≥ 4. (B) Bru1 binding to luciferase-osk-3’UTR upon pAbp knockdown was analyzed using GFP-RIP with subsequent RT-qPCR. The relative fold change in binding of GFP-Bru1 to luciferase-osk-3’UTR compared to control knockdown is illustrated. The individual enrichments were normalized to IP experiments using GFP alone. Error bars depict SEM, n = 3. (C) RIP experiments in either heterozygous (wild-type) or homozygous Mkrn1W ovaries using α-Bru1 antibody. The relative fold change in recovered endogenous osk mRNA in wild-type compared to Mkrn1W ovaries is depicted. As control RIP, normal IgG was used for every condition. Error bars indicate SEM, n = 4. (D-G) Immunostaining experiments showing Bru1 distribution in (D-E) wild-type and (F-G) Mkrn1W early-stage egg chambers. Note the more prominent accumulation of Bru1 in the oocyte in the Mkrn1 mutant. Scale bars, (D and F) 25 μm; (E and G) 20 μm. (H-M) Stage 10 egg chambers of the indicated genotypes immunostained with α-Osk. Posterior accumulation of Osk is restored to a variable degree (K-M) in Mkrn1W oocytes when heterozygous for bru1. Scale bars, 25 μm. (N) Quantification of posterior Osk localization in oocytes depicted in (H-M). The thresholds for weak, moderate, and strong are arbitrary. The photographs in the H-M panels illustrate what is meant by the different categories. n = 21 for wild-type, n = 52 for Mkrn1W, n = 100 for bru1/+; Mkrn1W. (O) Immunoblot analysis of protein lysates from ovaries depicted in (D-G). Heterozygous mutation of bru1 led to an increase of Osk protein levels in Mkrn1w ovaries.

