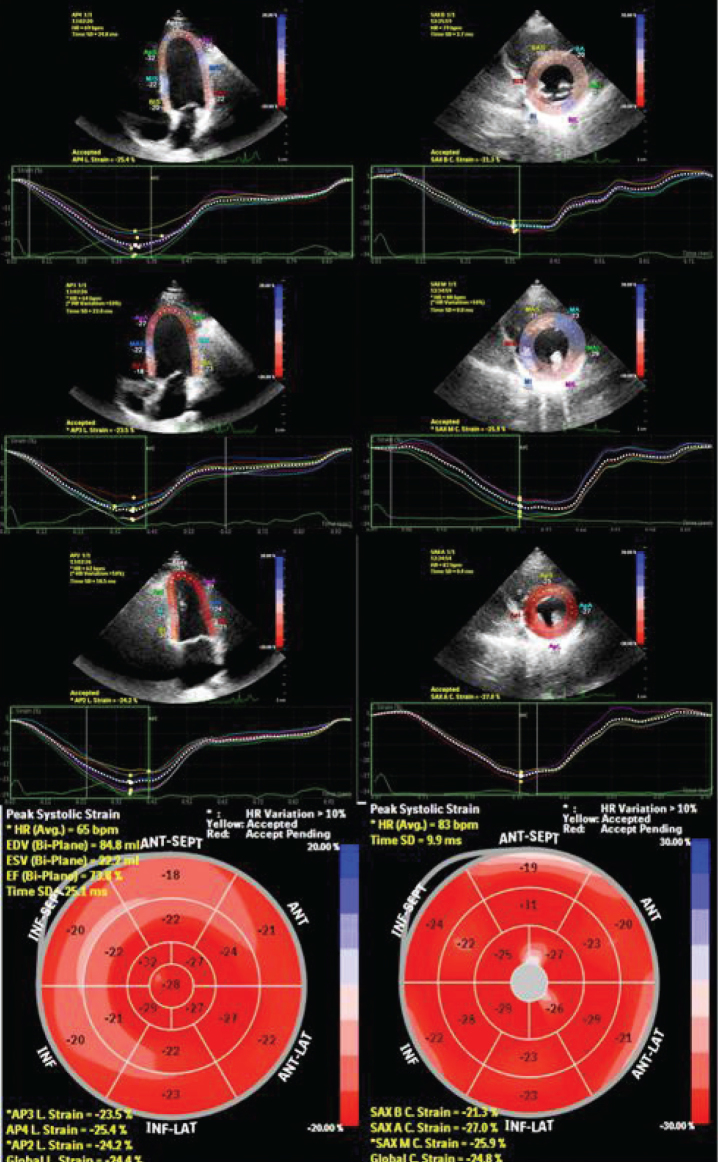
Figure 1.
The assessment of global longitudinal strain from the apical four-chamber, three-chamber and two-chamber views and global circumferential strain from basal, mid and apical short axis views. Each colored line represents corresponding myocardial segmental strain and the white dotted line represents the mean strain that was measured as changes of the whole myocardium of each view. The global longitudinal strain and global circumferential strain values are calculated as the average of the peak strain values of three apical views and three short axis views respectively.

