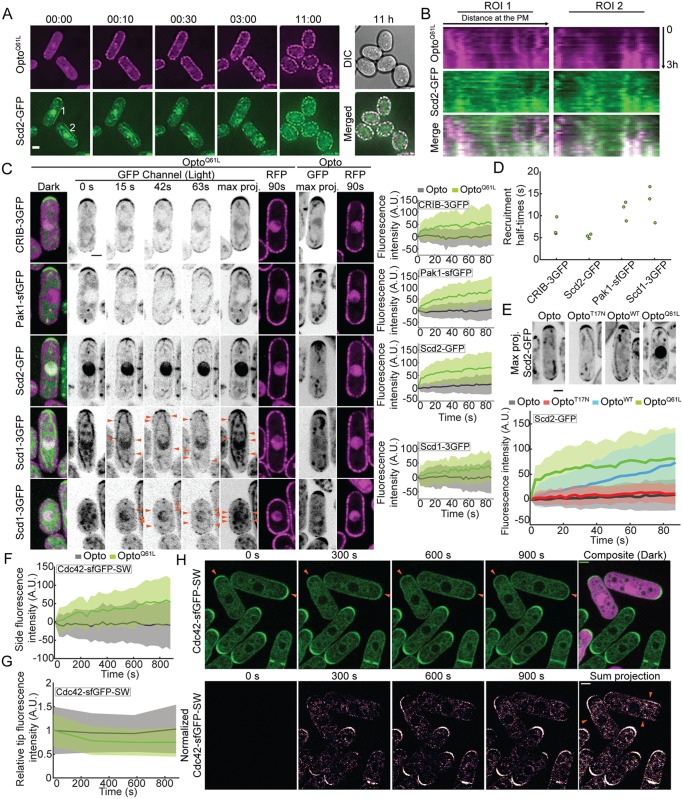
Fig 3. Visualizing the positive feedback triggered by Cdc42-GTP.
(A) Blue light–dependent Scd2-GFP relocalization to OptoQ61L foci during the transition from polar to isotropic growth (GFP, RFP, and DIC channels were acquired every 10 min). ROIs (2 pixel width) highlight cortical regions from where kymographs shown in (B) were generated. Time is shown in hh:mm. (B) Kymographs generated from ROIs shown in (A) over the first 3 h of time-lapse acquisition. x-axes of kymographs represent distance at the cell side and y-axes represent time. (C) OptoQ61L-induced cell-side relocalization of CRIB-3GFP probe and endogenously tagged Pak1-sfGFP, Scd2-GFP, and Scd1-3GFP in otherwise wt cells (B/W inverted images). Merged color images on the left show the dark, inactive state of OptoQ61L cells. The GFP max projection (“max proj.”) images show GFP maximum-intensity projections of 30 time points over 90 s and illustrate best the side recruitment of GFP-tagged probes. Orange arrowheads point to lateral Scd1-3GFP signal. RFP images show the cortical recruitment of CRY2PHR-mCherry-Cdc42Q61L (OptoQ61L) and CRY2PHR-mCherry (Opto) at the end of the time lapse. Quantification of GFP signal intensity at cell sides is shown on the right. N = 3; n > 20 cells per experiment; pCRIB-3GFP = 2.9e-13; pPak1-sfGFP = 4.8e-22; pScd2-GFP = 3.1e-18; pScd1-3GFP = 1.4e-04. For Scd1-3GFP (bottom 2 rows), 2 different examples of normal-sized (top) and small cells (bottom) are shown. The internal globular and filamentous signal is due to cellular autofluorescence (see S3B Fig for examples of unlabeled cells imaged in the same conditions). (D) Cell-side relocalization half-times of CRIB-3GFP, Scd2-GFP, Scd1-3GFP, and Pak1-sfGFP. Average half-times derived from 3 independent experimental replicates are plotted. (E) Relocalization to cell sides requires Cdc42 activity. (Top) Max projection images of Scd2-GFP (B/W inverted images) over 90-s illumination in Opto, OptoT17N, OptoWT, and OptoQ61L cells. (Bottom) Scd2-GFP relocalization dynamics at the sides of Opto, OptoT17N, OptoWT, and OptoQ61L cells. N = 3 experiments; n > 20 cells per experiment, except for the Opto sample, in which N = 6 independent experiments (1 × N = 3 in parallel to OptoQ61L and OptoWT, and 1 × N = 3 for OptoT17N). The OptoQ61L trace is the same as in (C). (F) OptoQ61L-induced cell-side accumulation of endogenous Cdc42-sfGFPSW in otherwise wt cells. N = 3; n > 20 cells per experiment; p = 4.2e-09. (G) OptoQ61L-induced decrease in Cdc42-sfGFPSW tip signal over time (pOptoQ61LVsOpto = 0.037). Note that measurements were performed at every 5-min time point only. (H) OptoQ61L-induced relocalization of endogenous Cdc42-sfGFPSW in otherwise wt cells. (Top) Mixtures of OptoQ61L (purple) and GFP control cell expressing Cdc42-sfGFPSW. Note tip accumulation Cdc42-sfGFPSW at t0, which is lost over time in OptoQ61L cells (arrowheads). (Bottom) Time lapse as in top row, but normalized by subtraction of initial time-point signal and pseudocolored. Note side signal in OptoQ61L cells (arrowheads), which represents gain of fluorescence intensity in respect to the initial time point (see Methods). The strong signal at the tips of wt cells is due to cell growth. In all graphs, thick line = average; shaded area = standard deviation. Bars = 2 μm. All underlying numerical values are available in S3 Data. A.U., arbitrary units; B/W, black and white; DIC, differential interference contrast; PM, plasma membrane; ROI, region of interest; wt, wild type.

