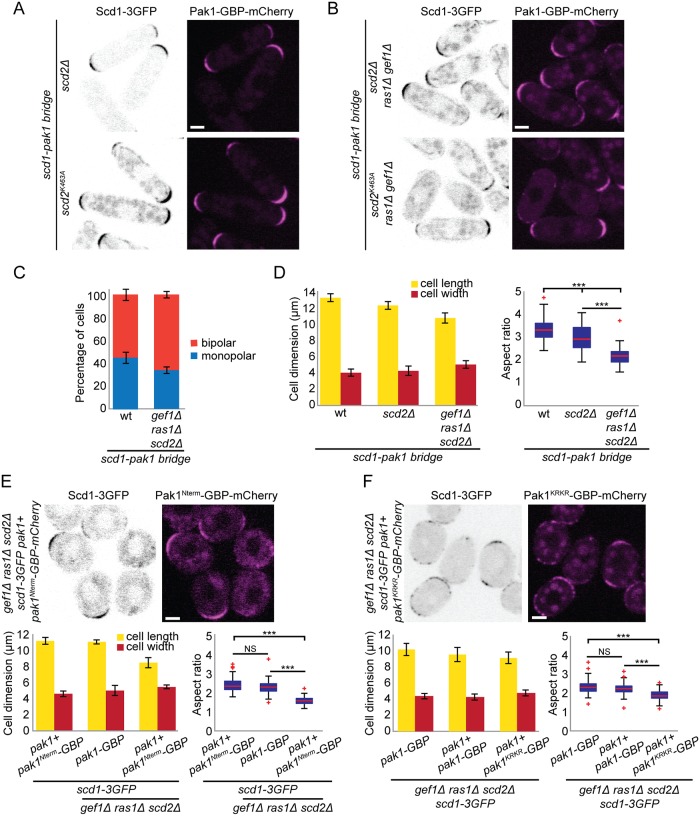
Fig 6. An artificial Scd1-Pak1 bridge is sufficient to sustain bipolar growth.
(A-B) Localization of Scd1-3GFP (B/W inverted images) and Pak1-GBP-mCherry (magenta) in scd2Δ and scd2K463A cells (A) or in scd2Δ ras1Δ gef1Δ and scd2K463A ras1Δ gef1Δ cells (B). (C) Mean percentage of bipolar septated cells of strains with indicated genotypes. N = 3 experiments with n > 30 cells. (D) Mean cell length and width at division (left) and aspect ratio (right) of wt, scd2Δ, and scd2Δ ras1Δ gef1Δ strains expressing the scd1-pak1 bridge. N = 3 experiments with n > 30 cells. ***3.5e-48 ≤ p ≤ 2e-7. (E-F) Localization of Scd1-3GFP (B/W inverted images) and Pak1Nterm-GBP-mCherry (magenta) (E) and Scd1-3GFP (B/W inverted images) and Pak1KRKR-GBP-mCherry (magenta) in scd2Δ ras1Δ gef1Δ strains (top) and mean cell length and width at division (bottom left), and aspect ratio (bottom right), of strains with indicated genotypes. N = 3 experiments with n > 30 cells. ***1.72e-50 ≤ p ≤ 4.2e-44 (E) and 1.17e-27 ≤ p ≤ 5.8e-23 (F). Bar graph error bars show standard deviation; box plots indicate median, 25th and 75th percentiles, and most extreme data points not considering outliers, which are plotted individually using the red “+” symbol. Bars = 2 μm. All underlying numerical values are available in S6 Data. B/W, black and white; GBP, GFP-binding protein; NS, not significant; wt, wild type.

