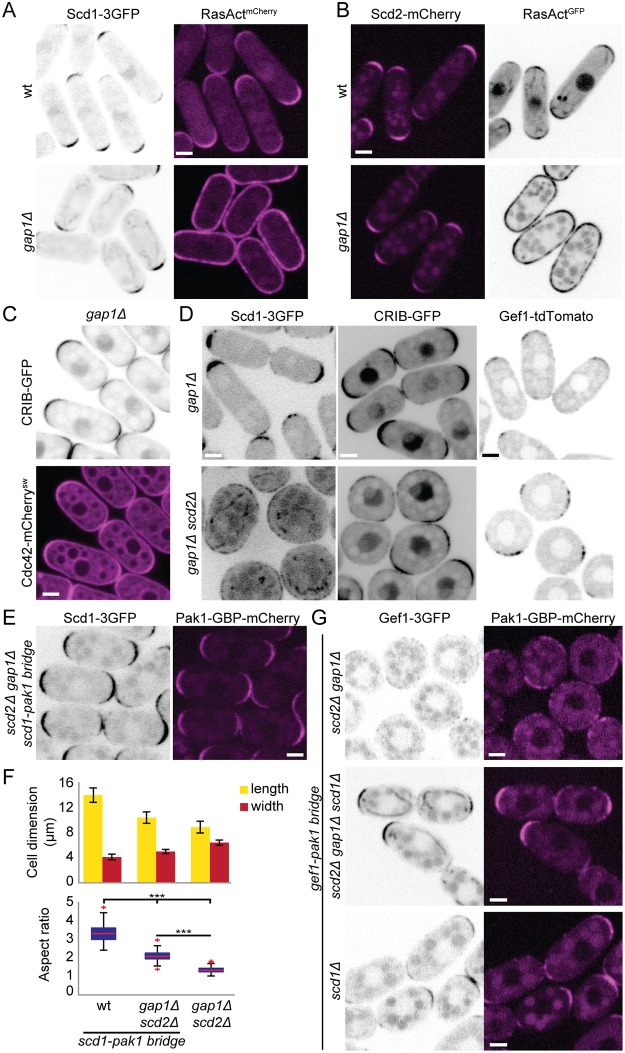
Fig 8. Scaffold-mediated positive feedback restricts Cdc42 activity to cell tips when Ras1 activity is delocalized.
(A-B) Localization of Scd1-3GFP (B/W inverted images) and RasActmCherry (magenta) (A) or Scd2-mCherry (magenta) and RasActGFP (B/W inverted images) (B) in wt and gap1Δ cells. (C) Localization of Cdc42-mCherrysw (magenta) and CRIB-GFP (B/W inverted images) in gap1Δ cells. (D) Localization of Scd1-3GFP, CRIB-GFP, and Gef1-tdTomato (B/W inverted images) in gap1Δ (top) and gap1Δ scd2Δ (bottom) cells. (E) Localization of Scd1-3GFP (B/W inverted images) and Pak1-GBP-mCherry (magenta) in gap1Δ scd2Δ cells expressing the Scd1-Pak1 bridge. (F) Mean cell length and width at division (top), and aspect ratio (bottom), of strains with indicated genotypes. N = 3 experiments with n > 30 cells. ***9.55e-72 ≤ p ≤ 4.6e-52. (G) Localization of Gef1-3GFP (B/W inverted images) and Pak1-GBP-mCherry (magenta) in scd2Δ gap1Δ, scd2Δ gap1Δ scd1Δ, and scd1Δ cells. Note that scd2Δ gap1Δ cells are round, whereas scd2Δ gap1Δ scd1Δ cells are rod-shaped. Bar graph error bars show standard deviation; box plots indicate the median, 25th and 75th percentiles, and most extreme data points not considering outliers, which are plotted individually using the red “+” symbol. Bars = 2 μm. All underlying numerical values are available in S8 Data. B/W, black and white; GBP, GFP-binding protein; wt, wild type.

