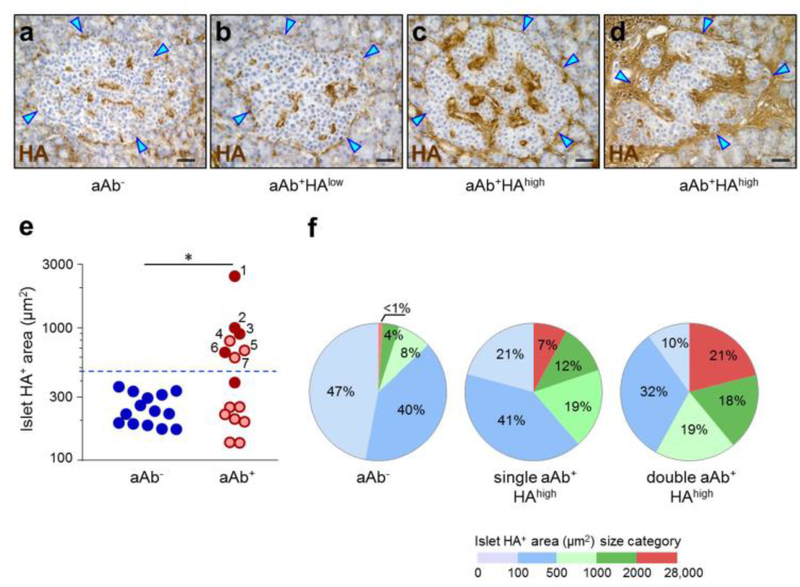
Fig. 2.
HA accumulates in islets from a subset of aAb+ donors. HA staining (brown) in islets from (a) aAb−, (b, c) single-aAb+ and (d) double-aAb+ donors. Arrowheads point to the islet border. Scale bars, 50 μm. (e) Morphometric quantification of islet HA+ areas, shown on a log10 scale. Each circle denotes an individual donor; blue, aAb−; light red, single-aAb+; dark red, double-aAb+. Data are mean values of islet HA+ areas for each individual donor. The numbers (1–7) indicate the aAb+HAhigh tissues ranked according to the size of islet HA+ areas. The dotted horizontal line indicates the upper cut-off value (mean of HA+ area in aAb−control + 3 SD). In total, 4598, 3210 and 2272 islets from aAb−, single-aAb+ and double-aAb+ donor tissues were analysed, respectively. (f) Islet HA+ area size distribution. The pie charts represent the percentage of islets with HA+ areas falling within each of the HA+ area size categories. Islets were analysed in aAb− tissues (n=4598 islets) and in aAb+HAhigh tissues from n=3 single-aAb+ donors (n=982 islets) and n=4 double-aAb+ donors (n=1828 islets). *p<0.001,single-aAb+HAhigh vs controls, and double-aAb+HAhigh vs single-aAb+HAhigh or controls; Mann–Whitney U test

