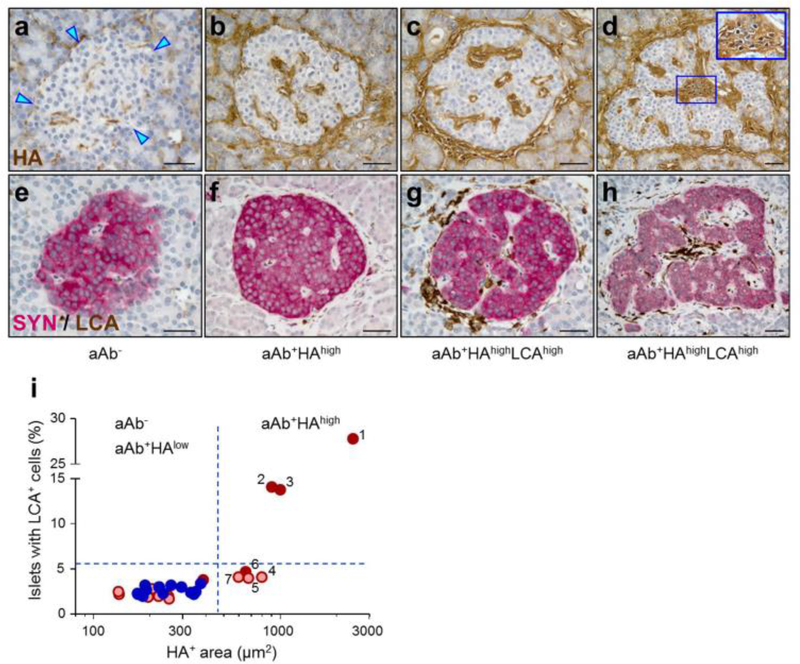
Fig. 3.
Islet HA accumulation takes place in the absence of insulitis. HA staining (brown) in islets from (a) aAb− and (b–d) aAb+ donors. Arrowheads point to the islet border. The area of insulitis in (d) is shown magnified in the inset. (e–h) Adjacent sections of the islets shown in (a–d), respectively, stained for LCA (brown) and SYN (red). Scale bars, 50 μm. (i) Prevalence of islets with LCA+ cell infiltrates plotted as a function of islet HA+ areas, shown on a log10 scale. Each circle denotes mean values for an individual donor. The dotted lines indicate the upper cut-off values (mean + 3 SD) of the measurements obtained from the aAb− controls. The numbers (1–7) indicate the aAb+HAhigh tissues ranked according to the size of islet HA+ areas. Blue, aAb−; light red, single-aAb+; dark red, double-aAb+

