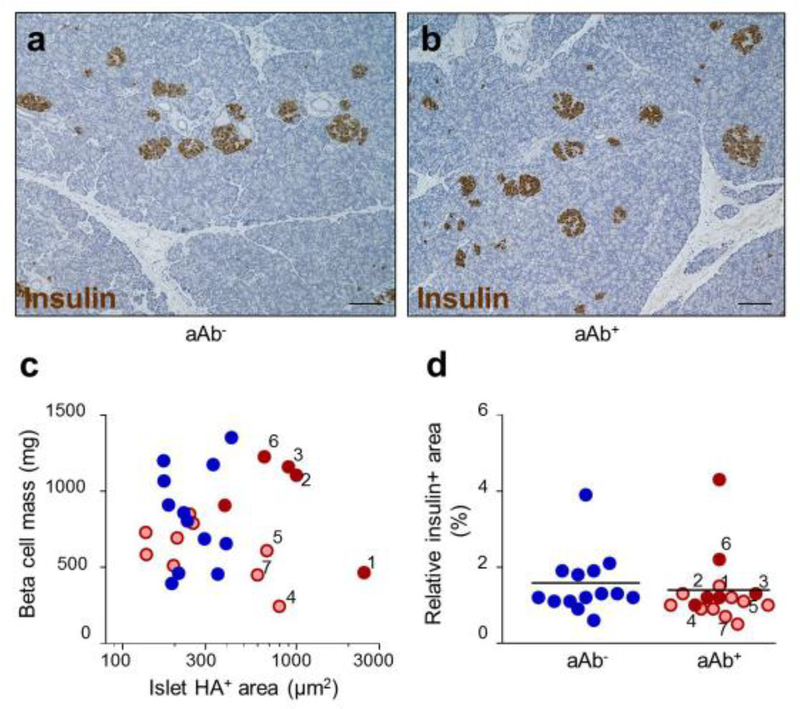
Fig. 5.
Relationship between islet HA and beta cell mass. Immunohistochemical staining for insulin (brown) in islets from (a) control aAb− and (b) aAb+HAhigh tissues. Scale bars, 100 μm. (c) Individual measurements of beta cell mass plotted as a function of islet HA+ area, shown on a log10 scale. (d) Insulin+ area relative to pancreas section area. Data are presented as the mean values of measurements for each individual donor. In (d), the horizontal lines represent the mean value in each group. The numbers (1–7) indicate the aAb+HAhigh tissues ranked according to the size of islet HA+ areas. Blue, aAb−; light red, single-aAb+; dark red, double-aAb+

