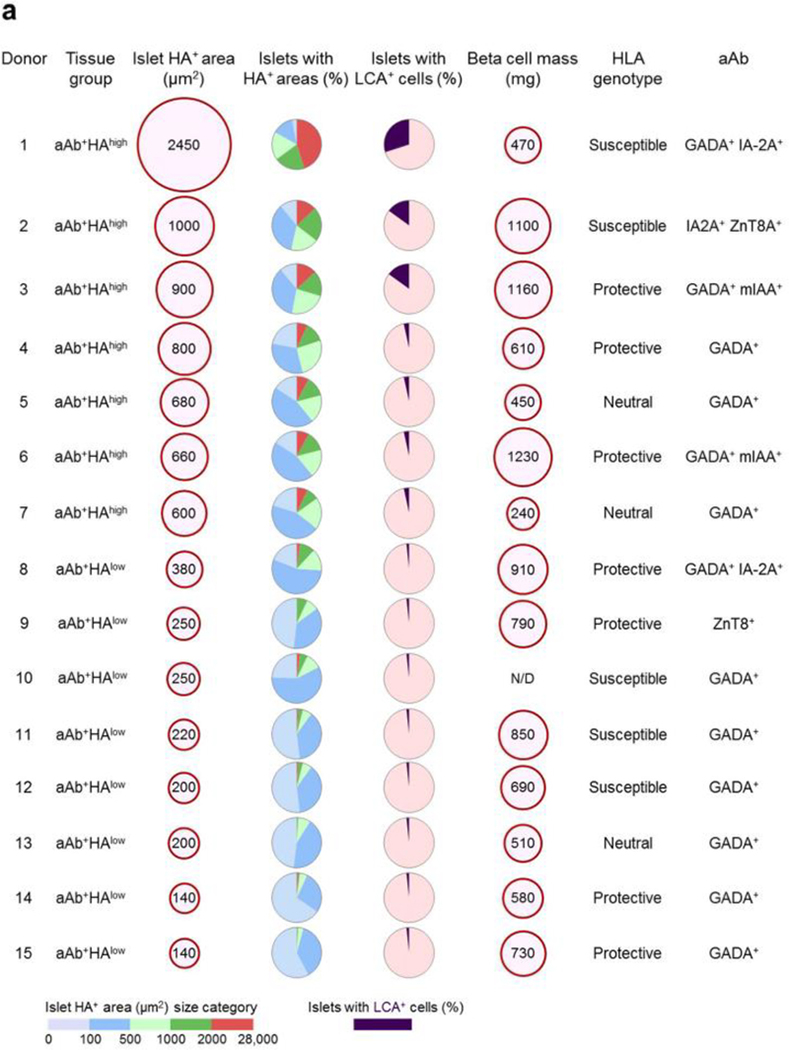
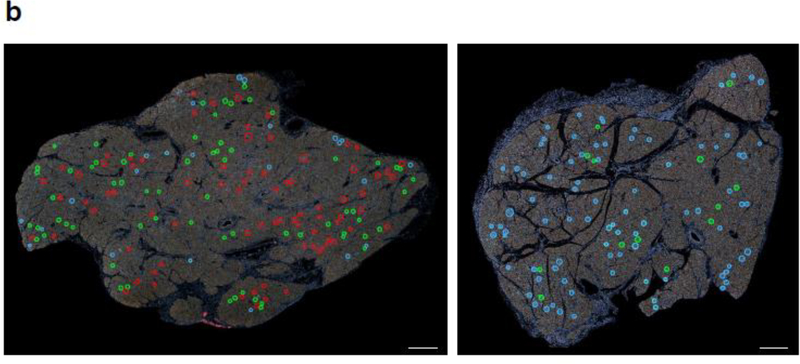
Fig. 6.
(a) Islet HA+ areas, insulitis and beta cell mass in individual aAb+ donors. Islet HA+ areas are shown as mean values obtained from the islets examined in each pancreas. Between 250 and 560 islets were analysed per pancreas. For ‘islet HA+ area’ and ‘beta cell mass’, the size of each red circle is proportional to the mean value, which is indicated within the circle. The pie charts represent the percentage of islets with HA+ areas falling within each of the HA+ area size categories or the percentage of islets with LCA+ cells. HLA genotype and aAb status are also shown for each donor. See ESM Fig. 6 for further analyses. (b) Whole slide images of pancreas tissue sections from donor 1 (aAb+HAhigh) and donor 13 (aAb+HAlow). The blue, green, and red circles show the islet border and the indicate islets with HA-stained areas ≤500 μm2, 501–2000 μm2 and >2000 μm2, respectively. Scale bars, 2000 μm. N/D, not determined


