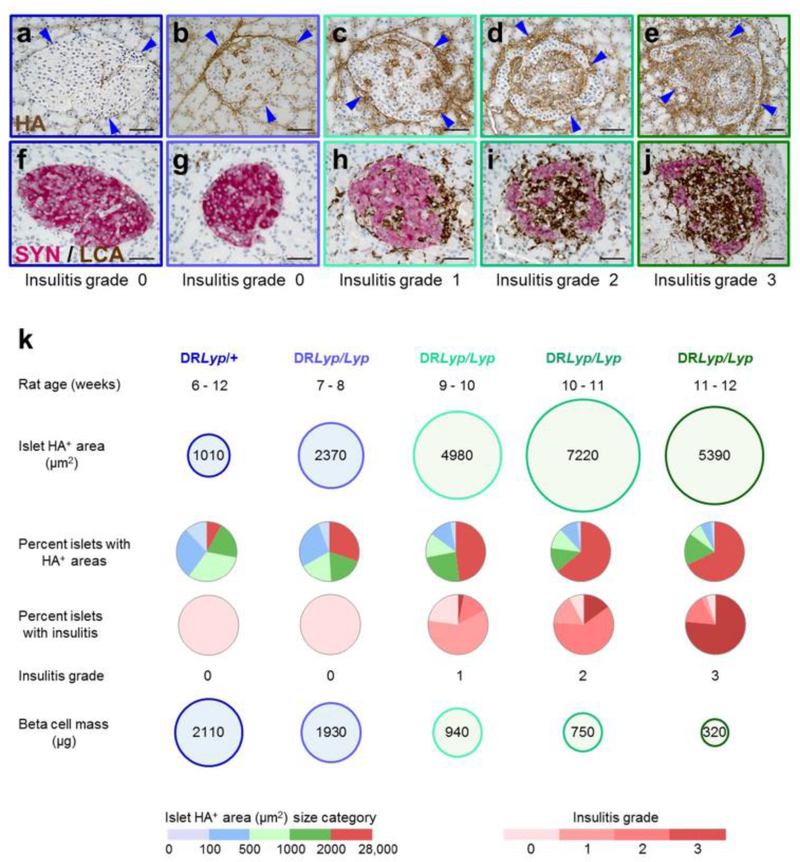
Fig. 7.
Islet HA accumulation precedes insulitis in presymptomatic DRLyp/Lyp rats. (a–e) HA staining (brown) in islets from (a) diabetes-resistant DRLyp/+ and (b–e) diabetes-prone DRLyp/Lyp rats. Arrowheads point to the islet border. (f–j) SYN (red) staining of islets from (f) DRLyp/+ and (g–j) DRLyp/Lyp rats. Scale bars, 50 μm. (k) Islet HA+ areas (mean in 300–400 islets/group), islet HA+ area size distribution, insulitis and beta cell mass in DRLyp/+ and DRLyp/Lyp rats. For ‘islet HA+ area’ and ‘beta cell mass’, the size of each circle is proportional to the mean value, which is indicated within the circle. The pie charts in represent the percentage of islets with HA+ areas falling within each of the HA area size categories or the proportion of islets with insulitis grade 0, 1, 2 or 3 in the rats within each age group (see ESM Table 3 for further details)

