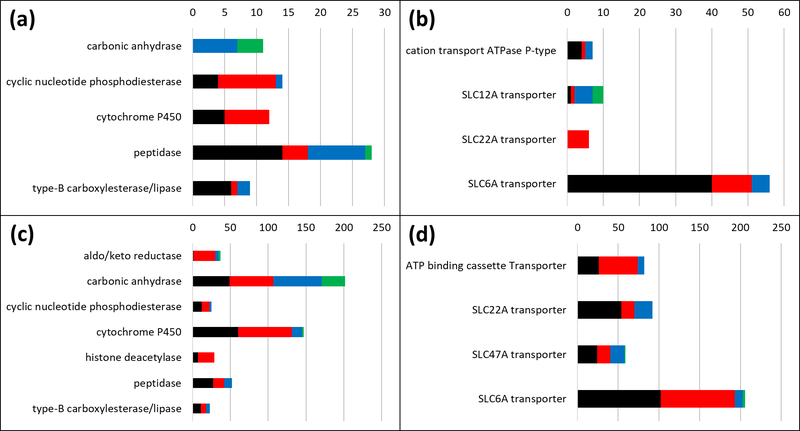
Figure 3.
BDDCS classes distributions for enzymes and transporters sub-families. (A) Drug-target records with annotated MoA for enzymes. (B) Drug-target records with annotated MoA for transporters. (C) Drug-target records without annotated MoA for enzymes. (D) Drug-target records without annotated MoA for transporters. On each plot, the horizontal axis reports the number of drugs and the vertical axis displays the sub-family name. Class 1, 2, 3 and 4 are depicted in black, red, blue and green respectively.

