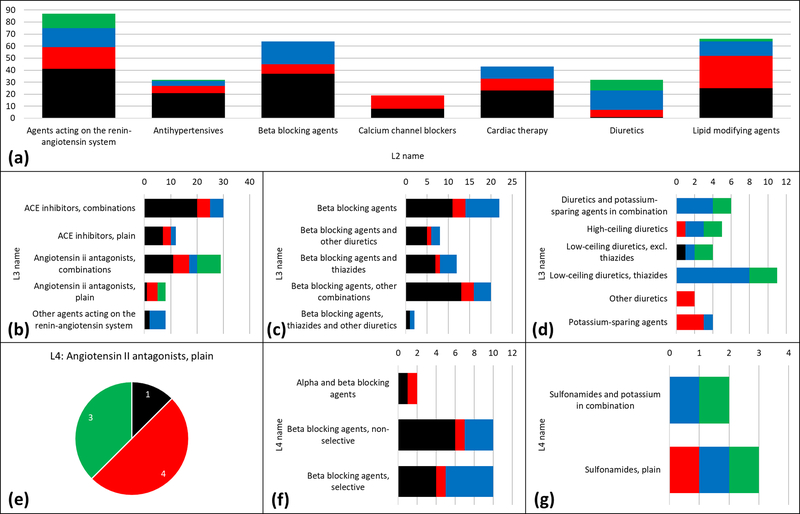
Figure 6.
(A) BDDCS distribution for cardiovascular system drugs by ATC level 2. (B) Level 3 distributions for agents acting on the renin-angiotensin system. (C) Level 3 distributions for beta blocking agents. (D) Level 3 distributions for diuretics (E) Pie chart of the unique ATC level 4 code of angiotensin II antagonists, plain. (F) Level 4 distributions for beta blocking agents (same name of level 3). (G) Level 3 distributions high-ceiling diuretics. On each plot, the number of drugs is reported. Class 1, 2, 3 and 4 are respectively depicted in black, red, blue and green.

