. 2020 Jan 6;9:e51998. doi: 10.7554/eLife.51998

Figure 1. aPBPs have no role in maintaining rod-like cell shape.

(A) Sketch of the strain AV44 (LC69 mrcB::gfp-mrcB, mrcA::rfp-mrcA) with tunable levels of RFP-PBP1a and GFP-PBP1b. CRISPR guides are expressed either as crRNA (top) or as sgRNA (bottom), see also Figure 1—figure supplement 1. (B) Doubling time of AV51 (AV44 ΔPBP1a)/pAV20 as a function of PBP1b level, in minimal medium with glucose and casamino-acids at 30°C. sgRNA are expressed from pAV20 as annotated. AV58 is AV51 Para-GFP-PBP1b for over-expression. Skull logo: not viable. (C) Effect of aPBP concentration on cell diameter. Points indicate the median diameter within each population. Green: AV51/pCRRNAcos with crRNA G20, G14, G10 and GØ, or AV58 (over-expression). Red: AV50 (AV44 ΔPBP1b)/pCRRNAcos with crRNA R20, R18, R11 and RØ. AV63 is AV50 HK022::Para-RFP-PBP1a for over-expression. Levels were determined based on fluorescence and normalized with respect to WT according to DIA. (D) Effect of the concentration of Rod-complex proteins on cell diameter. Green: AV88 (LC69 MreB-GFP)/pAV20 with sgRNA G14, G10 or GØ. Red: AV08 (LC69 RFP-PBP2)/pAV20 with crRNA R20, R18, R11 or RØ. (E) Growth curve of AV44/pAV20 with PBP1ab repressed to lethal level (sgRNA G20-R20), and cell morphology during lysis. Individual points are biological replicates. OD: optical density. WT: wild-type.

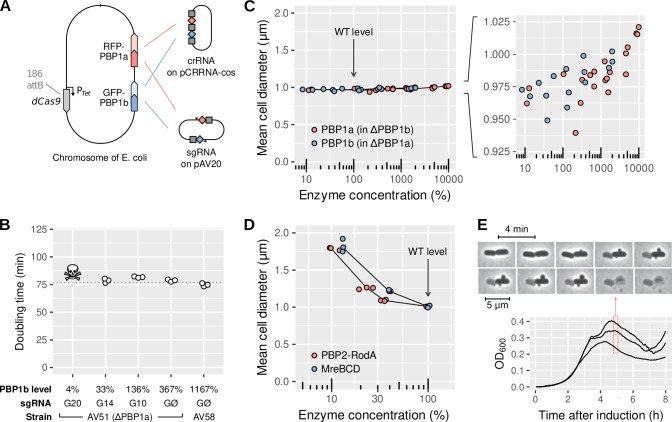
Figure 1—source data 1. Data used to generate Figure 1 and its supplements.

Figure 1.

Figure 1—figure supplement 1. Passage probability of the different CRISPR guides used in this study.

Figure 1—figure supplement 1.

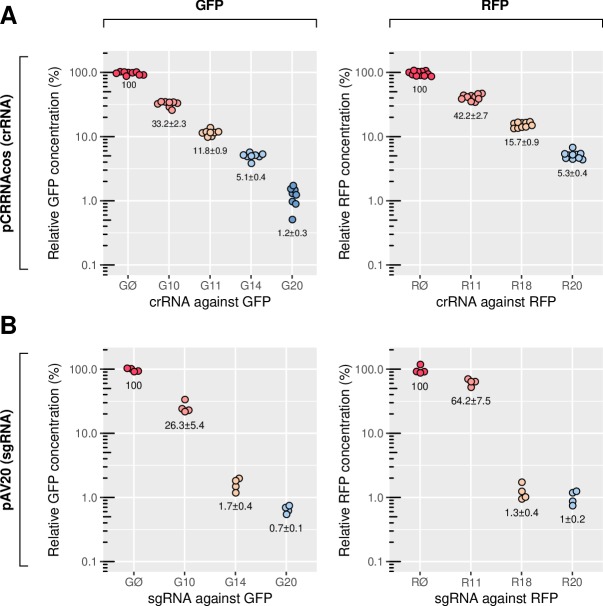
This is measured by fluorescence microscopy in strain AV47 (LC69 HK022::P127-msfgfp, λ::P127-mcherry)/pCRRNAcos for crRNA or pAV20 for sgRNA. When used to repress the RFP-PBP1a and GFP-PBP1b fusions in AV44, the repression level may be different because of genetic feedback. (A) Repression of GFP and RFP by crRNAs expressed from the pCRRNAcos vector. (B) Repression of GFP and RFP by sgRNAs expressed from the pAV20 vector. See Table 1 for the sequences of the guides. Relative fluorescence is expressed as a percentage of AV47/pAV20 GØ-RØ, that is without repression. Data is from Vigouroux et al. (2018).
Figure 1—figure supplement 2. The RFP-PBP1a and GFP-PBP1b fusions are the only forms of aPBPs present in AV44.

Figure 1—figure supplement 2.

(A) Fluorescent bocillin binds specifically to Penicillin Binding Proteins (PBP). The change in band intensity after repression by CRISPR does not reflect the change in fluorescence measured by microscopy for the same conditions, presumably because bocillin only labels potentially active molecules. All experiments are done in AV44/pCRRNAcos with crRNA as annotated. (B-C) Diameter of single cells at different levels of GFP-PBP1b (B) or RFP-PBP1a fusion (C), in strains AV100 (AV51 HK022::Para-GFP-PBP1b) and AV101 (AV50 HK022::Para-RFP-PBP1a), respectively. Different colors indicate different concentrations of arabinose, from 0% to 1%.
Figure 1—figure supplement 3. Quantification of GFP-PBP1b by semi-quantitative SDS-PAGE.

Figure 1—figure supplement 3.

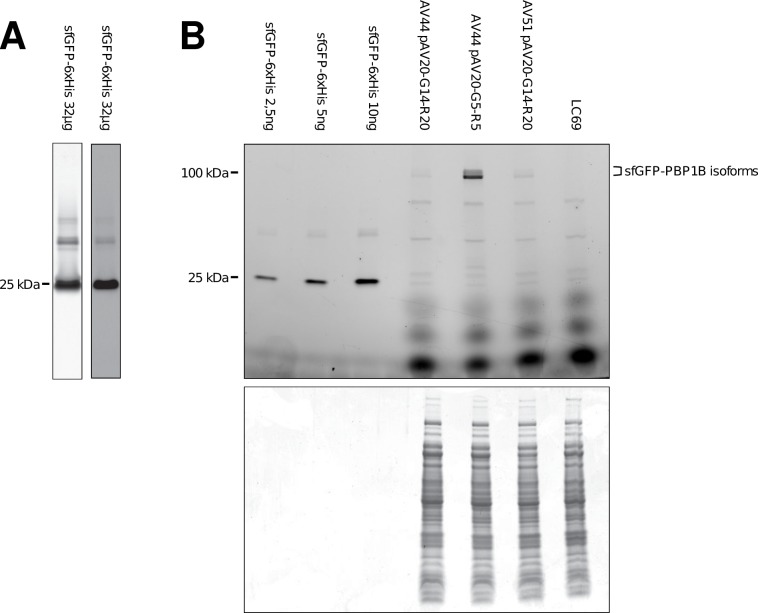
(A) Purified msfGFP-6xHis. Left: Elution fraction loaded in a 4–20% acrylamide gel stained with Coomassie blue. The predicted msfGFP-6xHis molecular weight is ≈28.42 kDa. Right: visualization of the in-gel fluorescent signal. (B) Representative 4–20% acrylamide gel with decreasing amounts of purified msfGFP-6xHis (first three lanes), followed with whole cell extracts of LC69, AV44 or AV51 with pAV20 as annotated. Approximately 30 μg of proteins were loaded. msfGFP-PBP1b isoforms: isoform α (predicted molecular weight 94.32 kDa, 121.1 kDa tagged with msfGFP), isoform μ (predicted molecular weight 88.91 kDa, 115.69 kDa tagged with msfGFP). Top: GFP fluorescence measurement. Bottom: Coomassie blue staining. There is no signal of the purified msfGFP-6xHis fusion protein because the amount loaded is probably below sensitivity limit for Coomassie blue staining.
Figure 1—figure supplement 4. Residual PBP1a and PBP1b levels in response to CRISPR-based repression, measured by fluorescence microscopy.

Figure 1—figure supplement 4.

Left: The same CRISPR guides produce different repression strength on GFP, depending on whether it is expressed constitutively in AV47 (186::Ptet-dCas9, HK022::P127-msfgfp, λ::P127-mcherry) or fused to PBP1b in the native locus (AV44). Right: Same experiment on the RFP-PBP1a fusion, on AV44, showing no evidence for feedback. sgRNAs are expressed from pAV20 with sgRNA GØ, RØ, G14 or R20 as annotated. In each case, relative fluorescence is expressed as a percentage of the fluorescence of the same strain carrying the pAV20 GØ-RØ control plasmid, that is without repression.
Figure 1—figure supplement 5. Dimensions of individual cells before lysis due to PBP1ab repression, in LB Strain: AV44/pAV20 G20-R20.

Figure 1—figure supplement 5.

Imaging starts 4h45 after the induction of the CRISPR system. Cell length and cell diameter are normalized with respect to the dimensions of the cell in the first frame of the movie. Solid lines are living cells, dashed lines are lysed cells (phase-bright). Colors are arbitrary.
Figure 1—video 1. Video of a cell of AV44/pAV20 with sgRNA G20-R20, bulging then lysing.
Download video file (57.7KB, mp4)
Timestamps start at the beginning of the movie, 5 hr after CRISPR induction. Corresponds to Figure 1E.