. 2020 Jan 6;9:e51998. doi: 10.7554/eLife.51998

Figure 2. Repression of PBP1ab reduces mechanical stiffness while maintaining a high rate of peptidoglycan insertion.

(A) Top: Steady-state amount of peptidoglycan per cell, measured in AV84 (AV44 ΔLysA)/pAV20 and AV105 (AV44 ΔPBP1b ΔLysA) as annotated. Bottom: Fraction of the peptidoglycan that is cross-linked in the same conditions. p-Values correspond to a two-sided t-test. NS: not significant. (B) Extension of the cells’ short axis (left) and long axis (right) after a 1 osm/L NaCl downshock, in AV93 (AV44 ΔMscLS)/pAV20 with sgRNA GØ-RØ or G14-R20. A value of one corresponds to no extension. Horizontal lines represent the medians. p-Values correspond to a two-sided permutation test. (C) Growth curves before and after a 1 osm/L osmotic downshock, in AV93/pAV20 with sgRNA GØ-RØ or G14-R20. The curves are scaled so all curves have the same OD at the moment of the shock. OD: optical density.

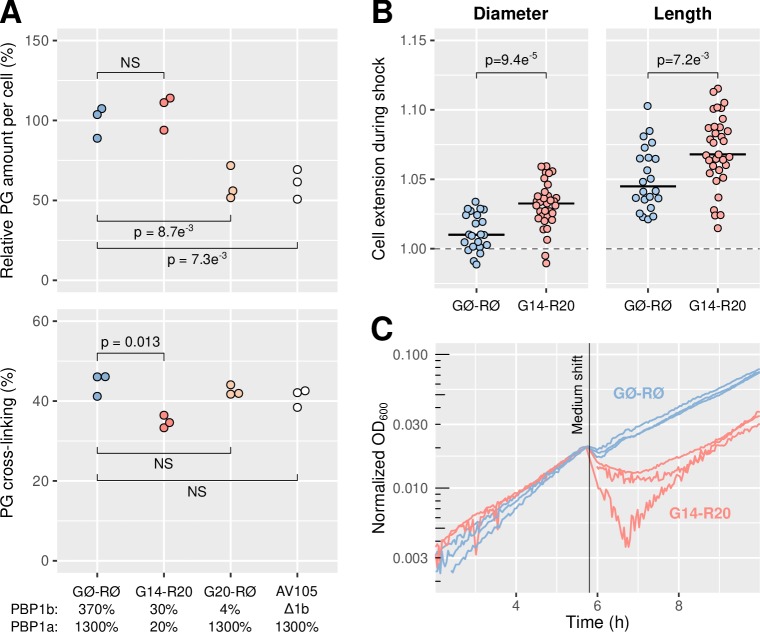
Figure 2—source data 1. Data used to generate Figure 2 and its supplements.

Figure 2.

Figure 2—figure supplement 1. Amount of incorporated 3H-mDAP per optical density as a function of time.

Figure 2—figure supplement 1.

Strains are AV84 (AV44 ΔlysA)/pAV20 GØ-RØ, AV84/pAV20 G14-R20, AV84/pAV20 G20-RØ and AV105 (AV84 ΔPBP1b)/pAV20 GØ-RØ, from left to right. The incorporated 3H-mDAP per cell is fit with formula kin/γ+kout(1-e-t*(γ+kout)t), where kin is the rate of mDAP incorporation, and kout the rate of turn-over, γ the growth rate and t the time (min). γ was measured to be 0.0069 min-1, kout was fit jointly for all curves and is equal to 0.012 min-1. Left: Colored curves are exponential fits (see Materials and methods) to the raw measurements (open symbols). Each color represents one biological replicate. CPM/OD600 values are proportional to the amount of incorporated mDAP per cell. Right: Fit values for the kin parameter. Experiment done in minimal medium.
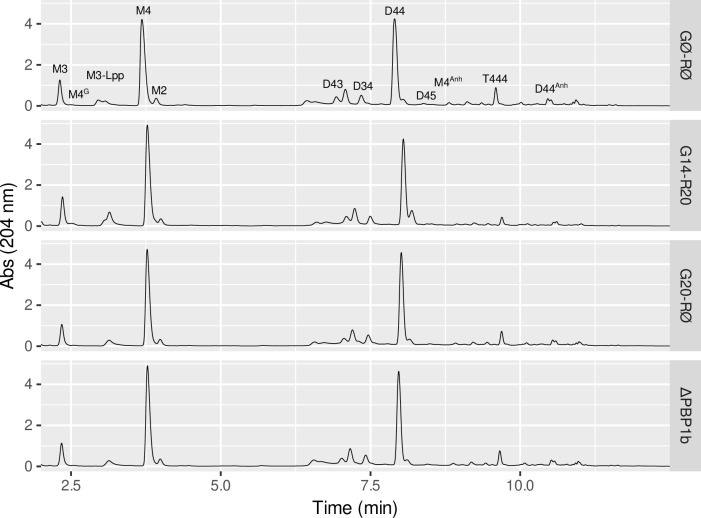
Figure 2—figure supplement 2. UPLC-UV chromatograms of the peptidoglycan after digestion by muramidase.

Figure 2—figure supplement 2.

From top to bottom, strains are AV84/pAV20 GØ-RØ, AV84/pAV20 G14-R20, AV84/pAV20 G20-RØ and AV105/pAV20 GØ-RØ (ΔPBP1b). Abs: absorbance.
Figure 2—figure supplement 3. Growth curves before and after osmotic shock in minimal medium.

Figure 2—figure supplement 3.

Strains are AV44 or AV93 (AV44 ΔmscSL) with either pAV20 GØ-RØ or G14-R20. Vertical lines mark the time of centrifugation, medium removal and resuspension in a medium of lower osmolarity. Normalized OD: Optical density normalized with respect to the value at the time of the medium shift. Each curve is one biological replicate. Experiment done in a plate-reader.
Figure 2—video 1. Video of sample cells in phase-contrast microscopy during an osmotic downshock.
Download video file (116.8KB, mp4)
Cells are expanding when the lower-osmolarity medium is flushed in the tunnel. The 1 osm/L osmotic downshock happens at 6 s. Corresponds to Figure 2B.