. 2020 Jan 6;9:e51998. doi: 10.7554/eLife.51998

Figure 3. PBP1b facilitates quick recovery from transient inhibition of peptidoglycan synthesis.

(A) Cell elongation before lysis from D-cycloserine treatment (1 mM) under the microscope, including sample snapshots. Strain is MG1655. Length is normalized to the length at the beginning of the movie. Solid lines describe growing cells, dashed lines correspond to phase-bright, lysing cells. Colors are arbitrary. (B) Effect of 1 mM D-cycloserine treatment on the cell-wall cross-linking rate, measured by UPLC on MG1655 before and after 1 hr of treatment. (C) Sensitivity to 1 mM D-cycloserine, for MG1655 (WT) and B150 (ΔPBP1b)/pBC03 (pBAD33-ParaPBP1b) with arabinose (overexp.) or without arabinose (non-induced). (D) Recovery after washout from 32 min of D-cycloserine treatment (1 mM), for B150/pBC03. PBP1b is either always induced, never induced, or induced 10 min before D-cycloserine washout. In (C-D), shaded areas correspond to mean ± standard deviation of three biological replicates. (E) Sample images of B150/pBC03 taken 10 min and 25 min after washout from 1 mM D-cycloserine. PBP1b is either induced from the beginning, induced 10 min before washout, or never induced. White arrows point to cells that died during the 15 min imaging window. (F) Doubling time measured from single living cells, over the 15 min imaging window, for the three different PBP1b induction times. Each point represents a field of view with 80 ± 40 cells (total 1152). (G) Fraction of the cells that visibly lysed during the 15 min imaging window. WT: wild-type. Normalized OD: optical density normalized to the initial value, at the beginning of the treatment or recovery. All panels are done in M63 minimal medium, except cultures on panel B that were prepared in LB.

Figure 3—source data 1. Data used to generate Figure 3 and its supplements.

Figure 3.

Figure 3—figure supplement 1. Effect of depletion of peptidoglycan precursors measured by MreB motion.

Figure 3—figure supplement 1.

Top: Probability distributions of the instantaneous velocity of MreB-msfGFP measured upon D-cycloserine treatment using strain B172 (MG1655 mreB::mreB-msfgfp) (A–C), or during depletion of mDAP in an auxotroph, B176 (MG1655 asd-1, mreB::mreB-msfgfp) (D). Bottom: Flux of MreB-msfGFP corresponding to the experiments in A, B, respectively. Flux is calculated as sum of track end-to-end distances divided by total cell area and movie duration. Medium is M63 minimal medium or LB, as indicated.
Figure 3—figure supplement 2. UPLC-UV analysis of the peptidoglycan, either on cells grown without treatment, or after 1 hr of 1 mM D-cycloserine treatment in MG1655 in LB.

Figure 3—figure supplement 2.

Figure 3—figure supplement 3. Damage sensitivity and recovery in LB.

Figure 3—figure supplement 3.

(A) Sensitivity to 1 mM D-cycloserine, for MG1655 (WT) and B150 (ΔPBP1b)/pBC03 (pBAD33-ParaPBP1b) with arabinose (overexp.) or without arabinose (non-induced). (B) Recovery after washout from 22 min of D-cycloserine treatment (1 mM), for B150/pBC03. PBP1b is either always induced, never induced, or induced 5 min before D-cycloserine washout. (C) Sensitivity to mDAP depletion in the mDAP auxotroph B151 (FB83 asd-1 van Teeffelen et al., 2011) for WT or B157 (FB83 ΔPBP1b asd-1)/pBC03 for non-induced/overexp. PBP1b is expressed at different levels like in (A). (D) Recovery of B157 (FB83 ΔPBP1b asd-1)/pBC03 after 32 min of mDAP depletion. PBP1b is either always induced, never induced, or induced 5 min before mDAP repletion/recovery. Shaded areas correspond to mean ± standard deviation of three biological replicates. Growth measurements are performed in shaking flasks (A) or microplate reader (B–D) in LB. WT: wild-type. Normalized OD: optical density normalized to the initial value, at the beginning of the treatment or recovery.
Figure 3—figure supplement 4. Detection of lysis events during D-cycloserine recovery.

Figure 3—figure supplement 4.

Sample images from movies taken during recovery from 32 min of 1 mM D-cycloserine treatment, with PBP1b never induced (top) or induced 10 min before drug washout (bottom). Two frames are super-imposed: 10 min after washout (red) and 25 min after washout (cyan). Growing cells have extended and thus appear to have cyan extremities. Lysed cells have typically shrunk and appear to have red extremities. They can also have bulged, making a cyan protrusion appear on the side of the cell. Cells that were already lysed on the first frame were not counted.
Figure 3—figure supplement 5. Alleviating effect of PBP1b expression after transient D-cycloserine treatment.

Figure 3—figure supplement 5.

(A,C) Instantaneous effective growth rate (sum of rates of growth and lysis) of B150/pBC03 as a function of time after drug washout following 32 min (A) or 22 min (C) of D-cycloserine treatment (1 mM) in minimal medium (A) or LB (C). PBP1b was induced either never (yellow) or right before washout (blue). Growth rate is calculated from an exponential fit to OD600 measurements (Figure 3D for minimal medium, Figure 3—figure supplement 3B for LB) from three consecutive time points. (B) Two-sided t-test between instantaneous growth rates at different time points indicates that PBP1b-expressing strains undergo significantly less lysis than non-expressing cells within 20 min after drug washout. The x-axis displays the last of the three time points considered for growth-rate calculation.
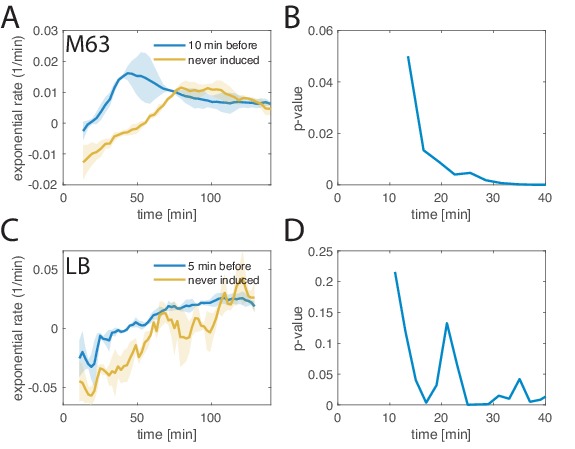
Figure 3—figure supplement 6. The E313D mutant of PBP1b (PBP1b*) enables growth without LpoB, but does not rescue D-cycloserine recovery.

Figure 3—figure supplement 6.

(A) Verification of PBP1b*’s functionality in ΔLpoB, in AV130 (GFP-PBP1b*, RFP-PBP1a, ΔLpoB) with single-guide RNAs carried by pAV20. With pAV20 GØ-RØ, both PBP1a and PBP1b* are expressed to high levels. With pAV20 GØ-R20, PBP1a is repressed strongly and only PBP1b* remains. With pAV20 G20-R20, both PBP1a and PBP1b* are strongly repressed, leading to culture collapse. (B) Recovery of AV29 (ΔPBP1b), AV31 (GFP-PBP1b) and AV128 (GFP-PBP1b*, ΔLpoB) after 32 min of 1 mM D-cycloserine treatment. Shaded areas correspond to mean ± standard deviation of 3 biological replicates. OD: optical density. All measurements are done in M63 minimal medium using a plate reader.
Figure 3—figure supplement 7. Sensitivity to 100 μM D-cycloserine at different levels of PBP1b.

Figure 3—figure supplement 7.

Growth curves of AV29 (ΔPBP1b), AV31 (GFP-PBP1b), MG1655 and AV128 (GFP-PBP1b*, ΔLpoB) in LB, measured with a plate reader. The fusions to GFP are expected to be over-expressed to about 370% of WT level. Shaded areas correspond to mean ± standard deviation of three biological replicates. Normalized OD: Optical density normalized to its value at the time of washout.
Figure 3—video 1. Movie of MG1655 cells lysing following D-cycloserine treatment in LB.
Download video file (1.2MB, mp4)
Timestamps start at the moment when the cells are transfered on the agarose pad with D-cycloserine. Corresponds to Figure 3A.
Figure 3—video 2. Sample of movies used for single-molecule tracking of MreB-GFPSW, with overlaid trajectories.
Download video file (878KB, mp4)
Top: Untreated cells, Middle: D-cyc treatment (20 min time point), Bottom: mDAP depletion (30 min time point). Corresponds to Figure 3—figure supplement 1.