. 2020 Jan 6;9:e51998. doi: 10.7554/eLife.51998

Figure 4. PBP1b localizes depending on the need for peptidoglycan synthesis.

(A-C) Calculated bound fraction of PBP1b at different levels of PBP1b, PBP1a and LpoB, using strains AV44, AV51 (ΔPBP1a) or AV110 (ΔLpoB). For GFP-PBP1b, sgRNA G14 (in pAV20), crRNA G10 (in pCRRNAcos) and crRNA GØ (in pCRRNAcos) are used to reach 30%, 130% and 370%, respectively. For RFP-PBP1a, sgRNA R20 (in pAV20), crRNA R18 (in pCRRNAcos) and crRNA RØ (in pCRRNAcos) are used to reach 20%, 280% and 1300%, respectively. Each point represents a biological replicate comprising at least 5000 tracks. Horizontal lines are means. p-Values are from permutation tests. (D-E) Bound fraction of PBP1b at different times during 1 mM D-cycloserine treatment (D) and during recovery from 30 min of D-cycloserine treatment (E) in the strain AV51/pCRRNAcos G10-RØ. Colored points are individual movies and white points are medians from one sample. Corresponding free diffusion coefficients are shown in Figure 4—figure supplement 4.
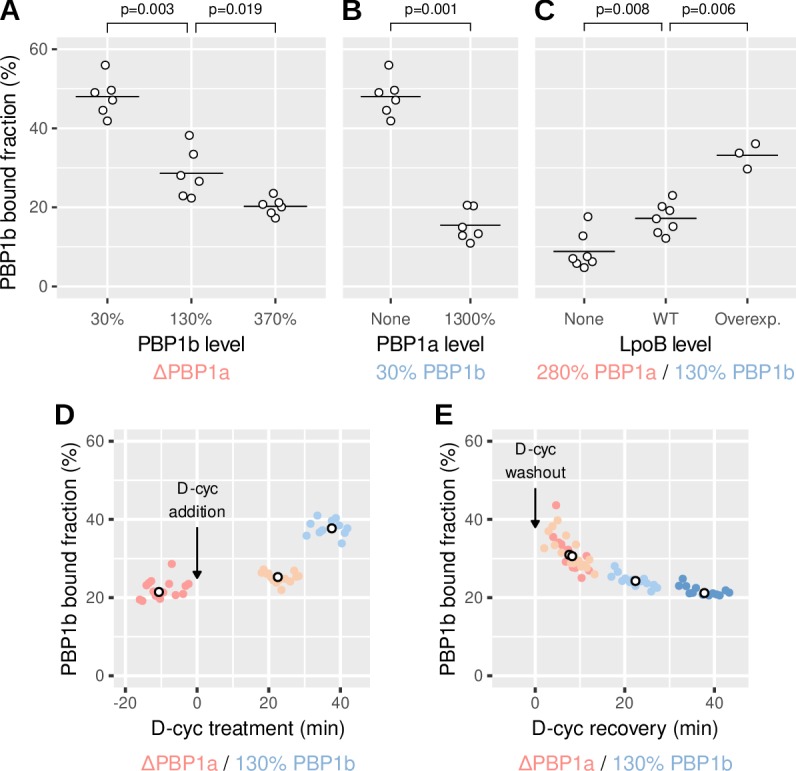
Figure 4—source data 1. Data used to generate Figure 4 and its supplements.

Figure 4.

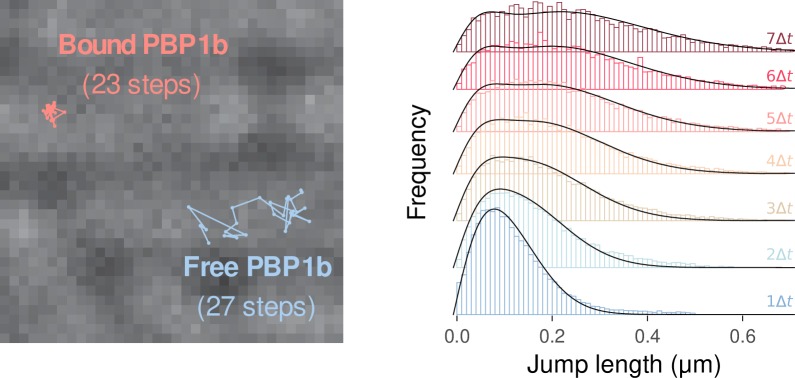
Figure 4—figure supplement 1. Tracking of single molecules and quantification of the fraction of bound molecules.

Figure 4—figure supplement 1.

Left: Sample tracks corresponding to bound and diffusive GFP-PBP1b molecules, overlaid on a brightfield image using strain AV44/pCRRNAcos G10-R18 (280% PBP1a, 130% PBP1b). Right: Observed and fit distributions of particle jump lengths over n time steps of Δt each, obtained using the Spot-On tool. Samples distributions are for one replicate of strain AV44/pCRRNAcos G10-R18.
Figure 4—figure supplement 2. Localization of bound molecules.

Figure 4—figure supplement 2.

(A-B) Mean positions of bound molecules with respect to a normalized cell-coordinate system, using 195 tracks in 67 cells of AV51 (AV44 ΔPBP1a)/pCRRNAcos with crRNA G10 (130% PBP1b with respect to WT) (A) and 130 tracks in 58 cells of AV44/pCRRNAcos with crRNA G10-R18 (130% PBP1b, 280% PBP1a with respect to WT) (B). Bound molecules were identified among tracks with at least five time points according to their MSD (MSDt=60ms<50nm2). Tracks were assigned to a cell if the distance from the axis of the cell was below 0.5 μm. The average length of cells was 3.5 μm. x-coordinate: Position of the track along the cell centerline, normalized by cell length. y-coordinate: Distance from cell centerline. C-D: Histograms of mean track positions along cell centerline normalized by cell length.
Figure 4—figure supplement 3. Calculated bound fraction of the PBP1b* mutant, compared to PBP1b with and without LpoB.
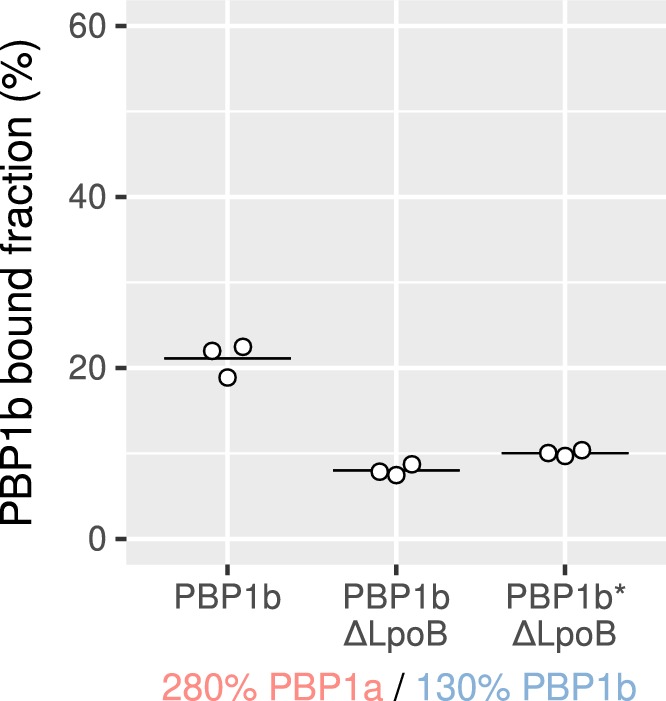
Figure 4—figure supplement 3.

The strains are AV44 (GFP-PBP1b, RFP-PBP1a), AV110 (GFP-PBP1b, RFP-PBP1a, ΔLpoB) and AV130 (GFP-PBP1b*, RFP-PBP1a, ΔLpoB). The PBP1a and PBP1b variants are repressed to 280% and 130% of WT level respectively using pAV20 G10-R18. Horizontal lines are means. p-Values are from permutation tests.
Figure 4—figure supplement 4. Diffusion coefficient of non-bound molecules during D-cycloserine treatment or recovery.

Figure 4—figure supplement 4.

Dfree of GFP-PBP1b at different times during 1 mM D-cycloserine treatment (A) and during recovery from 30 min of 1 mM D-cycloserine treatment (B) in the strain AV51/pCRRNAcos G10-RØ. Corresponding bound fractions are provided in Figure 4D and E.
Figure 4—video 1. Sample of TIRF-microscopy movies used for single-molecule tracking of GFP-PBP1b, with overlaid trajectories.
Download video file (9.4MB, mp4)
Left: AV51/pAV20 G14-RØ (PBP1b at 30% of WT, ΔPBP1a). Right: AV44/pAV20 G14-RØ (PBP1b at 30% of WT, PBP1a at 1300% of WT). These samples correspond to the conditions in Figure 4B.