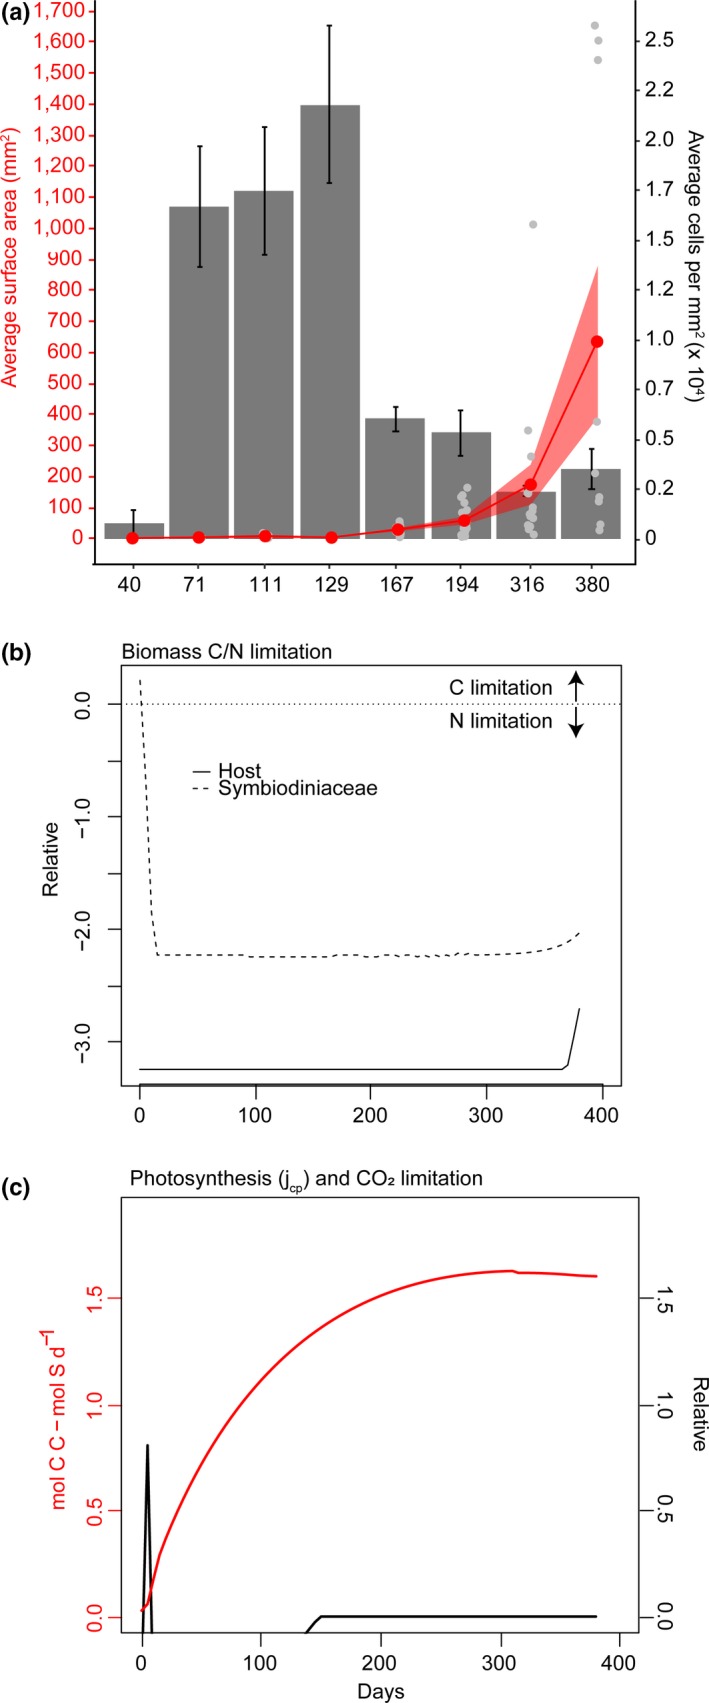
Figure 1.

Physiological (a) and bioenergetic model outputs (b, c) for Acropora tenuis juveniles outplanted in the field for 1 year. (a) Average surface area of juveniles (red line; mm2, red point means ± SE) and Symbiodiniaceae cell densities (average cells in ×104, grey barplots ± SE). (b) Relative ratio of carbon to nitrogen limitation in the host and Symbiodiniaceae populations modelled over 0–400 days of growth in the field. Solid and dashed lines represent host and Symbiodiniaceae values, respectively. Relative ratios are limitation coefficients that are unbounded by zero, where negative values are indicative of formation rates that are lower than maximum production rates in either the host or symbiont (negative: nitrogen limitation over carbon; positive: carbon limitation over nitrogen; zero: neither is limiting). (c) Estimated CO2 limitation (black line) (relative units as this is a ratio of substrate input fluxes) and photosynthesis (red line; mol C C ‐ mol S d−1) for juveniles modelled over 400 days. Relative values represent limitation coefficients, with zero signifying that neither carbon nor nitrogen are limited (Cunning et al., 2017)
