
Figure 1.
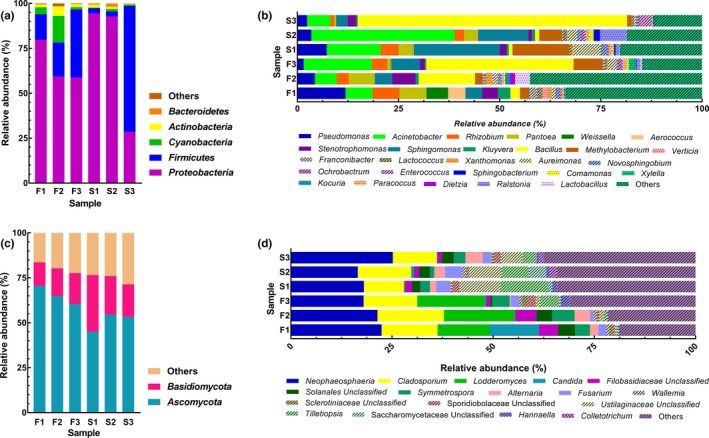
Plot of phylum and genus level relative abundances of prokaryotic and eukaryotic communities in FTLs. (a) and (b) represent prokaryotic communities at the level of phylum and genus; (c) and (d) represent eukaryotic communities at the level of phylum and genus. F1 to F3 denote fresh flavor style FTLs; S1 to S3 denote strong flavor style FTLs