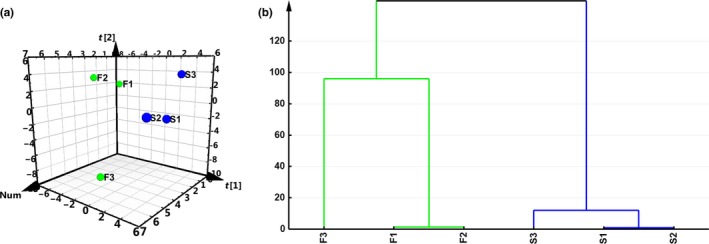
Figure 2.

Score scatter plot of PLS‐DA (a) and dendrogram of HCA (b). PLS‐DA of various FTLs is represented as a two‐dimensional representation of the scores (t[1] and t[2]) on the first and second PLS‐DA components. F1 to F3 denote the fresh flavor style FTLs; S1 to S3 denote strong flavor style FTLs
