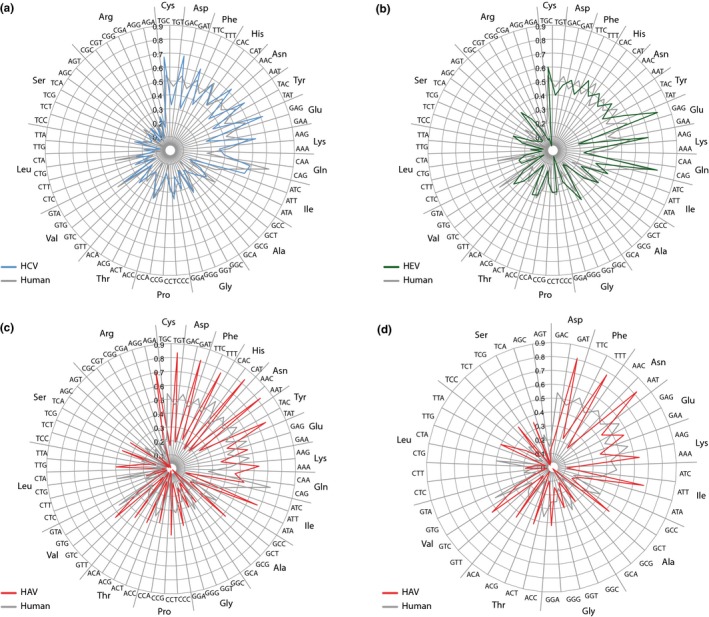
Figure 2.

Codon usage wheel plots of HCV, HEV, and HAV, compared with human codon usage. The viral codon usage shown is a calculated average of (a) 6 HCV genomes representing genotypes 1a, 2a, 3a, 4a, 5a and 6a', (b) 9 HEV genomes of genotypes 1‐4 of human, swine and rabit origines, and (c) 6 HAV genomes of genotypes IA, IB, IIA, IIB, IIIA and IIIB. Panel (d) shows the HAV codon usage for those amino acids used at frequencies >45% only. The codons are sorted for amino acids, with, from top clockwise, amino acids with 2, 3, 4, and 6 codons. Nonvariable amino acids are excluded
