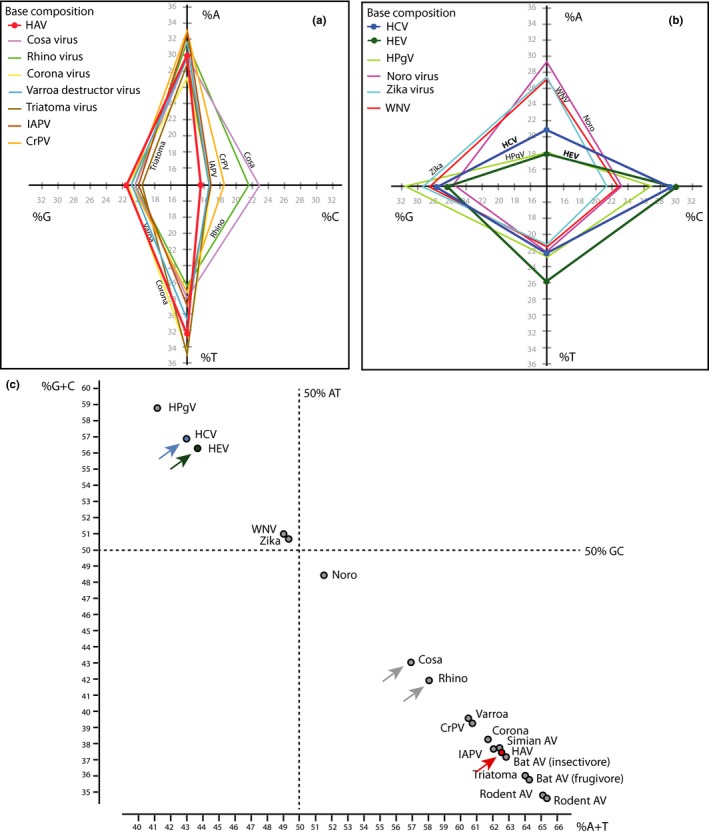
Figure 4.

Base composition of the various virus species. Individual base frequency is compared for AT‐rich genomes (protein‐coding regions only) of the HAV group (panel a) and of GC‐rich genomes of the HCV/HEV group (panel b). The % GC content of the genomes is compared in panel (c). This placed cosavirus and rhinovirus closer to the HAV group than to the HCV/HEV group (gray arrows). HAV is shown in red, HCV in blue and HEV in green, with colored arrows for clarity
