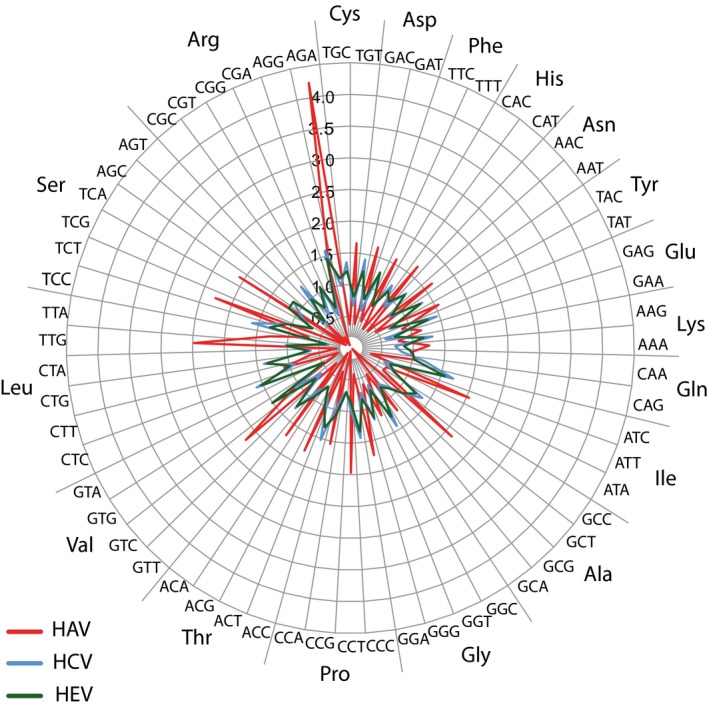
Figure A1.

Comparison of relative synonymous codon usage (RSCU) of HAV, HCV, and HEV. These values represent the over or underabundance of a given codon, with reference to the expected frequency based on nucleotide composition. The results are based on the average values of 6 HCV genomes of genotypes 1a, 2a, 3a, 4a, 5a, and 6a, respectively, 9 HEV genomes of genotypes 1–4 of human, swine and rabbit origines, and 6 HAV genomes of genotypes IA, IB, IIA, IIB, IIIA, and IIIB. The codons are sorted for amino acids, with, from top clockwise, amino acids coded by 2, 3, 4, and 6 codons. Nonvariable amino acids are excluded
