Figure 5.

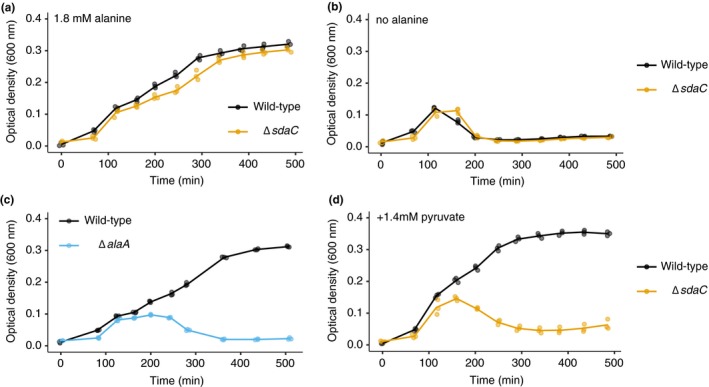
The lysis phenotype is associated with a high serine to alanine ratio. (a) Growth curves of wild‐type and ΔsdaC (sdaC::FRT, ecMK180) strains in AA‐rich medium with 1.4 mM glucose, no serine, and 1.8 mM alanine. (b) Growth curves of wild‐type and ΔsdaC (sdaC::FRT, ecMK180) strains in AA‐rich medium with 1.4 mM glucose, no serine, and no alanine. (c) Growth curves of wild‐type and ΔalaA (alaA::kan, ecMK165) strains in AA‐rich medium with 1.4 mM glucose, no serine, and 0.8 mM alanine. (d) Growth curves of wild‐type and ΔsdaC (sdaC::FRT, ecMK180) strains in AA‐rich medium with 1.4 mM glucose, no serine, 0.8 mM alanine, and 1.4 mM pyruvate. For all growth curves, three biological replicates are shown as points with their averages connected by lines
