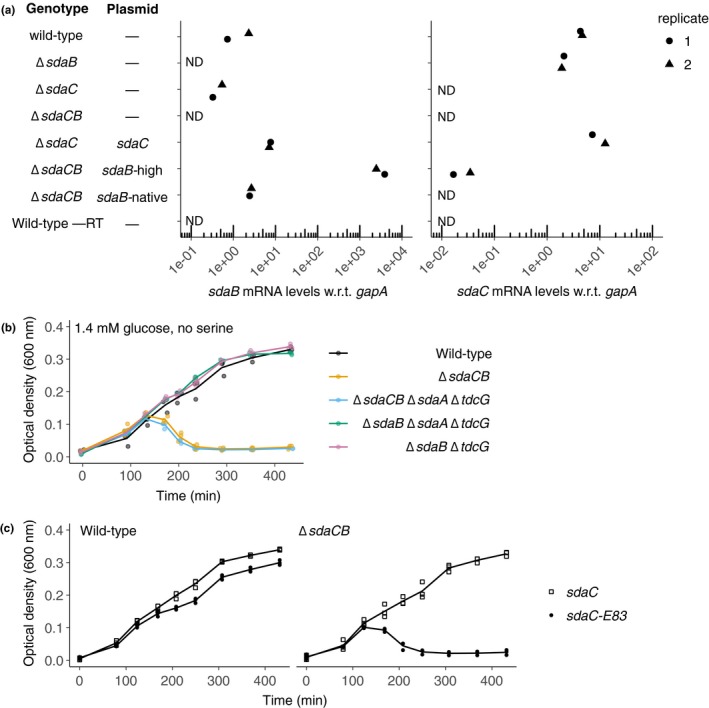
Figure A3.

Expression levels of sdaC and sdaB in various mutant strains and lysis phenotypes of strains harboring different combinations of serine deaminase operon deletions and/or plasmids. (a) mRNA levels, as measured using qRT‐PCR, in indicated strains (from top to bottom: BW25113, ecMK163, 180, 102, 186, 188, 195) grown to midexponential phase in AA‐rich medium containing 5 mM serine. mRNA levels for sdaC and sdaB were normalized to the control gene gapA. ND = not detected, –RT = no reverse transcriptase. (b) Growth curves of strains harboring mutations in 0–3 of the serine deaminase loci (from top to bottom: BW25113, ecMK102, 228, 237, 236) in AA‐rich medium containing 0.025% (1.4 mM) glucose and no serine. (c) Growth curves of wild‐type and ΔsdaCB strains harboring plasmids expressing full‐length or truncated SdaC (premature stop codon at E83) in AA‐rich medium containing 0.025% (1.4 mM) glucose and no serine (ecMK136, 141, 221, 222). For growth curves, three biological replicates are shown as points with their averages connected by lines
