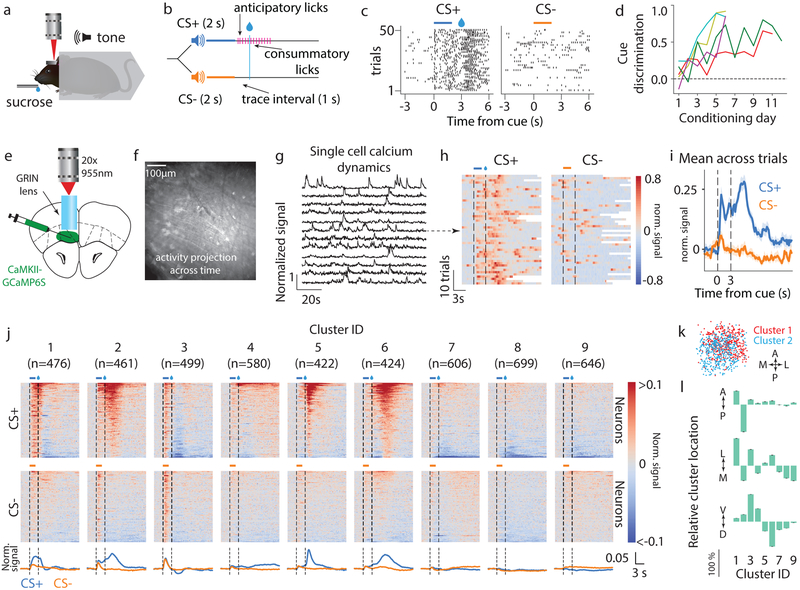
Fig. 1. vmOFC CaMKIIα-expressing (OFC-CaMKII) neurons display heterogeneous response profiles reflecting cue, reward, and associative information following behavioral acquisition.
a. Headfixed Pavlovian conditioning, b. Task schematic, c. Example behavioral session from a trained animal showing anticipatory licking to CS+ but not CS-. d. Evolution of behavioral discrimination between cues (Methods) for 5 individual mice from whom imaging data were acquired. e. Schematic of imaging, f. Example standard deviation projection of activity across time from a trained animal. g. Example calcium dynamics showing normalized fluorescence signal (Methods). h. Example neuron’s (arrow) normalized fluorescence signal aligned to cue (peristimulus time histogram, or PSTH) with trials sorted by delay to first lick (see Supplementary Fig 2 for licking behavior and more example neurons). White bars indicate start of next trial. i. PSTH showing mean normalized signal across n=50 trials. Shaded region is standard error of the mean. Please note that we show PSTHs only to provide a visualization of raw data, and not as a directly analyzable signal (Methods). j. Classification of neurons into 9 response clusters based on their trial-averaged activity after animals were trained (Methods, Supplementary Fig 3, 4). PSTHs of individual neurons are shown and sorted on the y-axis. Bottom traces represent population average within each cluster. Clusters are ordered by mean activity between cue and reward. k. Relative spatial location across field of view for two example clusters (A: anterior, P: posterior, M: medial, L: lateral, Methods). l. Relative percentage shift in the mean location of a cluster with respect to the mean of all neurons, normalized to the cluster with the maximum shift along each cardinal axis (D: dorsal, V: ventral, raw data in Supplementary Fig 3e). Error bars represent standard error of the mean. Statistical results are in Supplementary Table 1 for all figures.

