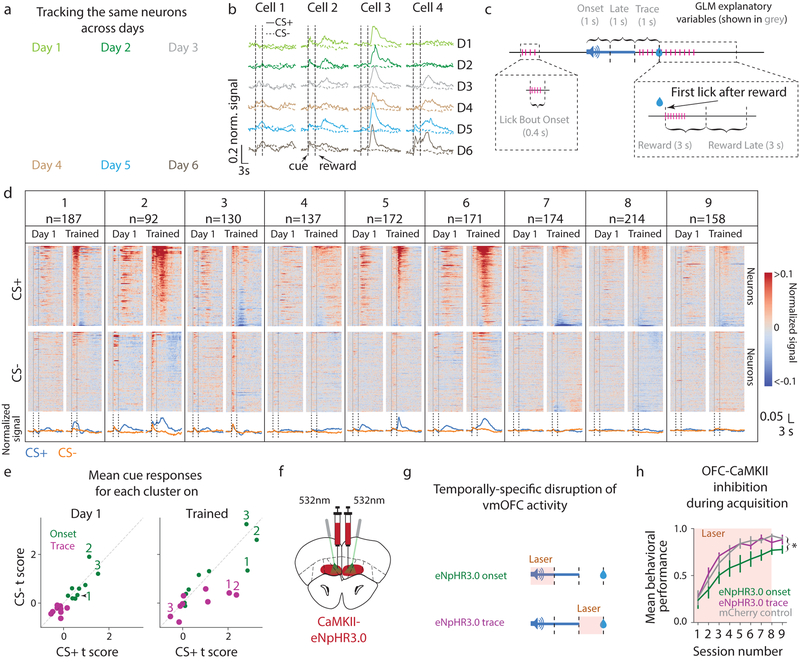
Fig. 2. vmOFC neuronal activity exhibits cue onset responses, and evolves responses reflecting cue-reward associations during behavioral acquisition.
a. Activity projection images from one animal (yellow in Fig 1d) showing that the same cells can be tracked across days. b. Example neurons’ PSTH around cues shown for every day of behavior from naïve to trained (CS+ solid, CS- dashed) c. Schematic of the epochs analyzed using a GLM (Methods) fit to individual neurons’ deconvolved fluorescence. d. PSTHs on Day 1 and Trained, recorded from all longitudinally-tracked neurons. Neurons are sorted by their responses on Trained, with the same ordering maintained on Day 1. e. Mean GLM t scores (Methods) of responses across a cluster to CS+ and CS- during the onset (1 s after cue onset) or trace period. Three example clusters are labeled. It is possible that GLM estimates are biased against detecting suppression in activity (Supplementary Fig 1c) f. Schematic of optogenetic experiment to target OFC-CaMKII neurons. g. Schematic for temporally-specific disruption of vmOFC activity during either the cue onset or the trace interval epochs. h. Behavioral acquisition of reward seeking to CS+ while OFC-CaMKII neurons are inhibited during the cue onset or trace period, or in control animals without opsin expression (Methods). Inhibition during the cue onset period suppressed learning, but not expression of learned behavior (Supplementary Fig 7) Measure of center is the mean and error bars represent standard error of the mean. * represents p<0.05 (see Supplementary Table 1 for exact p values, sample sizes and tests).

