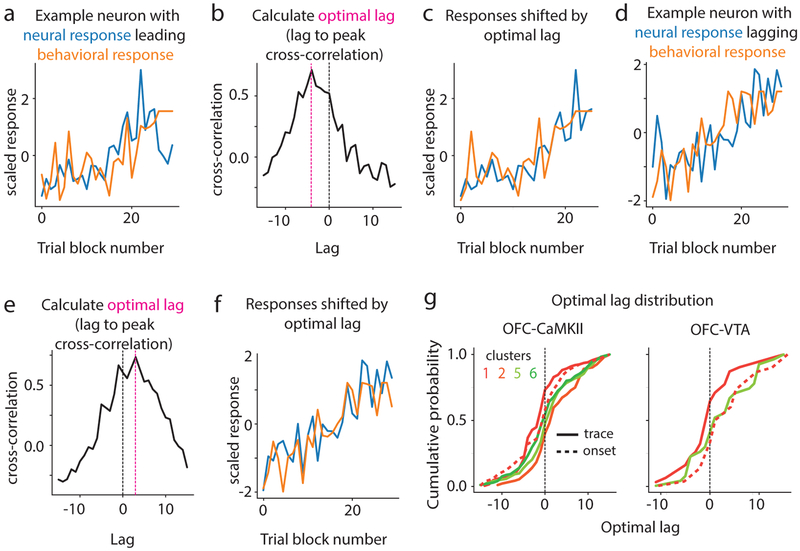
Fig. 5. Different time courses of learning across clusters.
a. Behavioral evolution and the neural response evolution of an example neuron whose response evolution leads behavior. b. Cross-correlation analysis showing that peak cross-correlation is at a negative optimal lag, i.e. with neural response leading behavior. c. Behavioral and neural response evolution shifted by the optimal lag, showing high correlation. d-e. Same as a-c but for a neuron whose evolution lags behavior (positive optimal lag). g. Distribution of optimal lags for neurons within a cluster for the learning-related clusters of OFC-CaMKII and OFC-VTA neurons. Trace interval response of cluster 1 shows a significant negative mean lag, but no other response, including cue onset response of cluster 1, shows significant negative lag.

