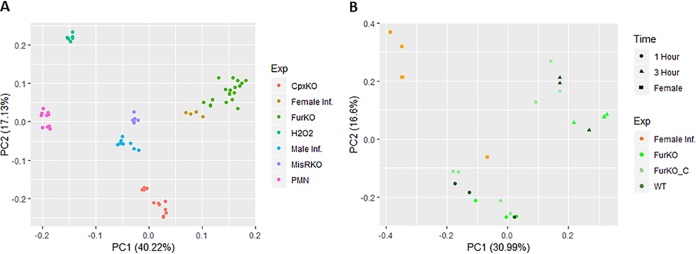
FIG 1.
Principal-component analysis of conditions. (A) PCA analysis was carried out to define distances between all samples. Color indicates the experimental group, with the variability explained by the first and second principle components on the x and y axes, respectively. The group Cpx contains both cpxA and cpxR mutant data as well as the WT data from this experiment. The same grouping is carried out with fur and misR data, and the wild-type strain is included in each of these experimental clusters. For female and male infection, H2O2, and PMN exposure data, the control data sets are also included in the experimental group. (B) Specific analysis of several data sets that were tightly clustered in panel A. Two experiments are included in this graph: analysis of a fur mutant strain at 1 and 3 h after the addition of iron and analysis of N. gonorrhoeae during female genital tract infection. Colors indicate specific experiments and, for fur mutant experimental conditions, circles indicate 1 h after the addition of iron and triangles indicate 3 h after the addition of iron, while squares indicate infection of female genital tract.

