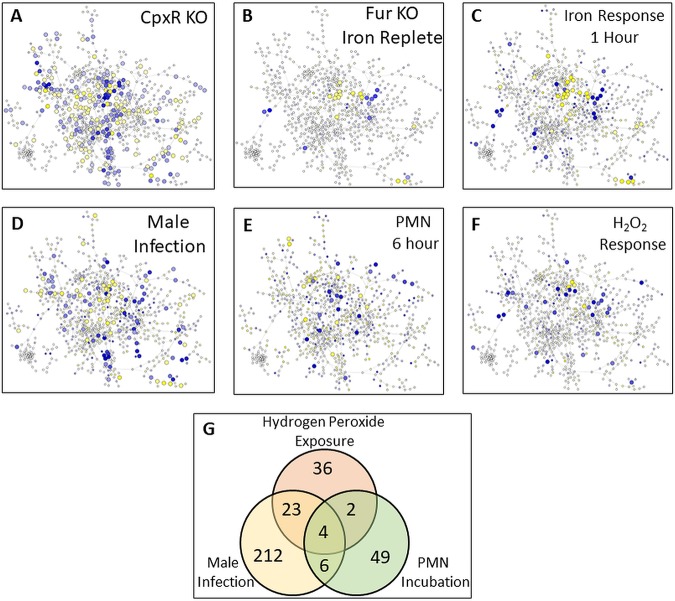
FIG 3.
Response of the gonococcal network to specific conditions. Genes within the network responding to specific conditions are shown. For each condition, expression data were compared between treatment (either a mutant strain or environmental perturbation) and a control (either a wild-type strain or an environmental control). Genes showing a >2-fold change in expression with an adjusted P value of <0.05 are shown as larger nodes in the network. Large yellow nodes indicate genes that were expressed at higher levels under control versus treatment conditions, and large blue nodes indicate genes that were expressed at lower levels under control versus treatment conditions. The color shading of the node indicates the strength of the response: darker nodes show a stronger response, either increased or decreased. (A) Analysis of cpxR mutant strain. (B) Analysis of fur mutant strain under iron-replete conditions. (C) Analysis of the gonococcal response 1 h after the addition of iron. (D) Analysis of infection of the male genital tract. (E) Analysis of incubation in PMNs after 6 h. (F) Analysis of response to H2O2 incubation. (G) A Venn diagram showing the number of differentially expressed genes for three oxidative stress-related conditions (hydrogen peroxide exposure, infection of the male genital tract, and incubation in PMNs) and the overlap in differentially expressed gene (DEG) number for each pair of conditions and for all three conditions.

