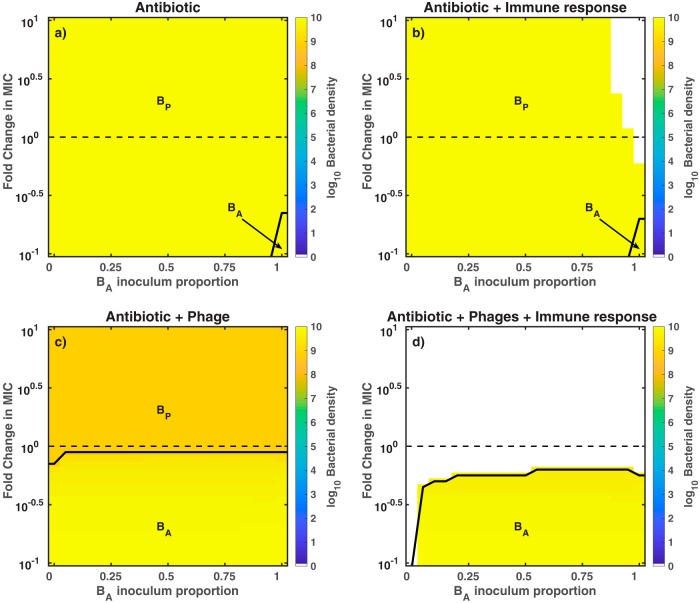
FIG 5.
Outcomes of the robustness analysis for different antimicrobial strategies. We simulate the exposure of bacteria to different antimicrobial strategies, such as antibiotic-only (a), antibiotic plus innate immunity (b), phage plus antibiotic (c), and phage-antibiotic combination in the presence of innate immunity (d). The heatmaps show the bacterial density at 96 h postinfection. Colored regions represent bacterial persistence (e.g., orange areas for ∼109 CFU/g and bright yellow areas for ∼1010 CFU/g), while the white regions represent pathogen clearance. We vary the concentration of ciprofloxacin (MIC = 0.014 μg/ml), ranging from 0.1× MIC (0.0014 μg/ml) to 10× MIC (0.14 μg/ml), and the bacterial composition of the inoculum, ranging from 100% phage-sensitive bacteria (0% BA) to 100% antibiotic-sensitive bacteria (100% BA). Initial bacterial density and phage density (c and d) are B0 = 7.4 × 10⁷ CFU/g and P0 = 7.4 × 10⁸ PFU/g, respectively. Phage and antibiotic are administered 2 h after the beginning of the infection.

