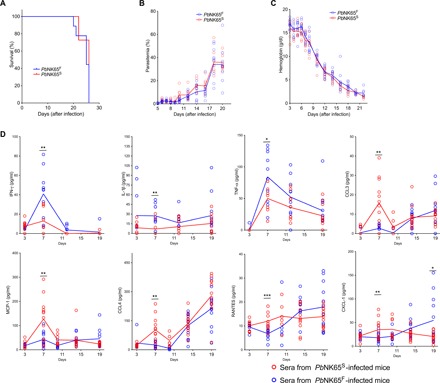
Fig. 2. PbNK65F infection leads to stronger IFN-γ and TNF-α responses in infected mice.

(A to C) C57BL/6 mice were infected with either PbNK65F or PbNK65S using 106 iRBCs per mouse delivered intraperitoneally. Changes in survival (A), parasitemia (B), and hemoglobin levels (C) were monitored during the course of infection. Each circle represents an individual mouse. Data represent three independent experiments each carried out with at least 10 animals per group. (D) Sera collected at different time points of mice infected, as described above. Time-dependent changes in serum levels of various cytokines and chemokines are quantified using a multiplex enzyme-linked immunosorbent assay (ELISA) strategy. Data represent two independent experiments. Each circle refers to a single mouse and lines denote mean values. Statistically significant differences are shown with asterisk (* = 0.01 < P ≤ 0.05; ** = 0.001 < P ≤ 0.01; *** = 0.0001 < P ≤ 0.001). Statistical significance was calculated using Welch’s t test (F)
