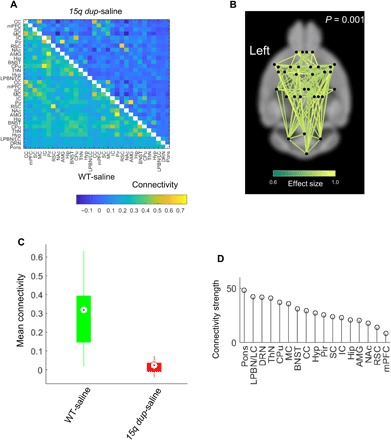
Fig. 1. NBS detect global hypoconnectivity in 15q dup mice.

(A) Group-averaged connectivity matrices (Pearson correlation coefficients) in WT-saline (bottom, n = 15) and 15q dup-saline groups (top, n = 10). Color bar represents the Pearson correlation coefficient. (B) Network of reduced connectivity in the 15q dup-saline group identified with the NBS (P = 0.001). Connections are colored according to effect size (Cohen’s d). (C) Box plot showing distribution of network-averaged connectivity in WT-saline and 15q dup-saline groups. Connectivity averaged over the connections comprising the network in (A). Circles indicate medians, and boxes indicate 25th and 75th percentiles. (D) Extent to which individual regions are affected by the network of reduced connectivity in the 15q dup group. Strength is the sum of effects sizes across all connections associated with a given region. Strength is averaged between contralateral regions. CC, anterior cingulate cortex; mPFC, medial prefrontal cortex; SC, somatosensory cortex; IC, insular cortex; Pir, piriform; RSC, retrosplenial cortex; NAc, nucleus accumbens; AMG, amygdala; Hip, hippocampus; BNST, bed nucleus and stria terminus; Hyp, hypothalamus.
