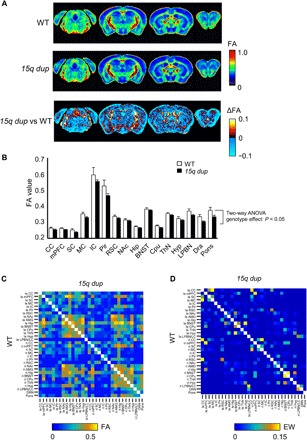
Fig. 3. FA and structural connectivity in 15q dup mice.

(A) Group-averaged FA maps in WT (top, n = 10) and 15q dup mice (middle, n = 12) and differences of FA between WT and 15q dup groups (bottom). Color bar, FA value and ΔFA. (B) Averaged FA values within each ROI in WT (n = 10) and 15q dup mice (n = 12). (C) Mean FA and (D) EW structural connectivity in the same ROIs as functional connectivity in WT (bottom) and 15q dup (top) groups. Color bar, FA or EW.
