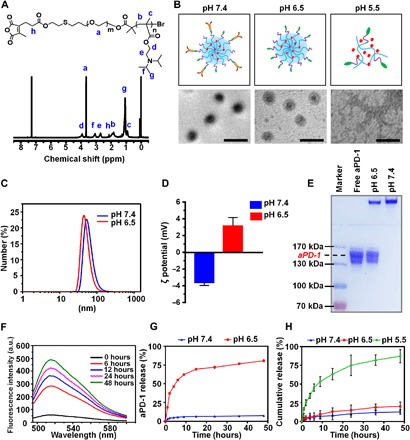
Fig. 1. Characterizations of CUR@PPC–aPD-1.

(A) 1H NMR spectrum of CDM-PEG-PDPA in CDCl3. ppm, parts per million. (B) Scheme and transmission electron microscopy (TEM) images of CUR@PPC–aPD-1 at various pH values. Scale bars, 100 nm. (C) The particle sizes of CUR@PPC–aPD-1 at pH values of 7.4 and 6.5 determined by dynamic light scattering (DLS). (D) The ζ potential of CUR@PPC–aPD-1 at pH values of 7.4 and 6.5 determined by DLS analysis (n = 3; means ± SD). (E) SDS–polyacrylamide gel electrophoresis (PAGE) picture of CUR@PPC–aPD-1 pretreated at pH values of 6.5 and 7.4 (5 μg of aPD-1 per sample). (F) Fluorescence spectra of Alexa Fluor 488–labeled nanoparticle (CUR@PPC–aPD-1/AF488) in PBS of pH 6.5 at different time points (concentration, 0.5 mg/ml). a.u., arbitrary units. (G) In vitro aPD-1 release from CUR@PPC–aPD-1 at pH values of 7.4 and 6.5 (n = 3; means ± SD). (H) In vitro CUR release from CUR@PPC–aPD-1 at pH values of 7.4, 6.5, and 5.5 (n = 3; means ± SD).
