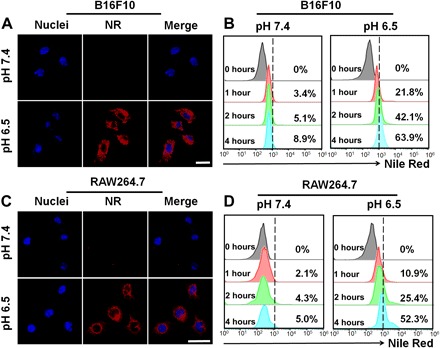
Fig. 2. T cell binding and cellular uptake of nanodrug.

Cellular uptake of NR@PPC–aPD-1 in B16F10 tumor cells at pH values of 7.4 and 6.5 determined by CLSM imaging (A) and flow cytometry (B) analyses (concentration of NR@PPC–aPD-1, 1 μM). Scale bar, 25 μm. Cellular uptake of NR@PPC–aPD-1 in RAW264.7 macrophages at pH values of 7.4 and 6.5 determined by CLSM imaging (C) and flow cytometry (D) analyses (concentration of NR@PPC–aPD-1, 1 μM). Scale bar, 25 μm.
