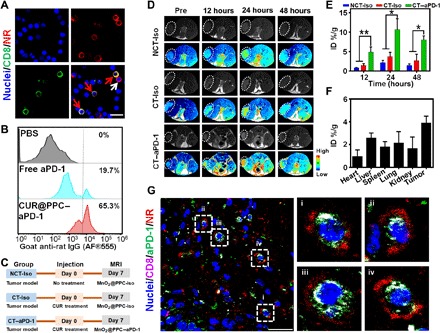
Fig. 4. Evidence for T cell–mediated drug delivery in mice bearing subcutaneous B16F10 tumor.

(A) CLSM images illustrate the binding of NR@PPC–aPD-1 to PD-1+ T cells at 12 hours after tail vein injection. All lymphocytes were separated from the mice blood. CD8+ T cells were labeled with Alexa Fluor 488 (green fluorescence), cell nuclei were stained with DAPI (4′,6-diamidino-2-phenylindole) (blue fluorescence), and NR (red fluorescence) replacing CUR was encapsulated for fluorescence visualization. Scale bar, 30 μm. Red arrows indicate nanodrug-bound PD-1+CD8+ T cells, and white arrow illustrates a PD-1+CD8− T cell attached with nanodrug. See fig. S5 for images of low magnification acquired at three different time points (dose of NR@PPC–aPD-1 in vivo, 300 μg/kg body weight). (B) Flow cytometry analyses of CD8+ T cells (gated on CD3+CD4−CD8+ T cells) were blocked by Alexa Fluor 555–labled aPD-1 in tumor at 3 days after tail vein injection of PBS, free PD-1, and CUR@PPC–aPD-1 (dose of aPD-1 in vivo, 1.2 mg/kg body weight). (C) Illustration of in vivo magnetic resonance imaging (MRI) study schedule. (D) In vivo T1-weighted MRI (T1WI) of the B16F10 tumor-bearing mice after tail vein injection of MnO2@PPC–aPD-1 or MnO2@PPC-Iso at a dose of 13 mg/kg body weight. MnO2 replacing CUR was encapsulated for T1WI measurements. Black and white and pseudocolored images are shown for each group. (E) Quantitative analysis of Mn2+ contents in tumor site with inductively coupled plasma optical emission spectrometry (ICP-OES) at 12, 24, and 48 hours after tail vein injection of MnO2@PPC–aPD-1 (n = 3; means ± SD; *P < 0.05, **P < 0.01). Statistical analyses were performed using ANOVA with Tukey’s test. CT-Iso and CT–aPD-1 groups were pretreated with CUR. (F) Quantitative analysis of Mn2+ distribution in major organs and tumor tissue with ICP-OES at 24 hours after tail vein injection of MnO2@PPC–aPD-1 without CUR pretreatment (n = 3; means ± SD). (G) CLSM images of tumor section exhibiting distribution of aPD-1 (green fluorescence) and NR (red fluorescence) at 24 hours after tail vein injection of NR@PPC–aPD-1 at a dose of 300 μg/kg body weight. CD8+ T cells were labeled with Alexa Fluor 647 (purple fluorescence), cell nuclei were stained with DAPI (blue fluorescence), NR with red fluorescence replacing CUR was encapsulated for fluorescence visualization. See fig. S7C for nonoverlapped fluorescence images. Scale bar, 30 μm.
