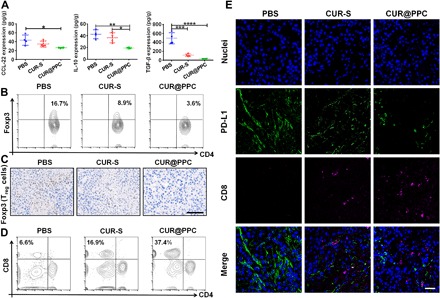
Fig. 5. CUR@PPC promoted infiltration of CD8+ T cells into tumor.

(A) Expression levels of immunosuppressive cytokines CCL-22, IL-10, and TGF-β analyzed by ELISA assay in B16F10 tumors of mice at 15 days of in vivo study schedule (see fig. S9A) (n = 4; means ± SD; *P < 0.05, **P < 0.01, ***P < 0.001, ****P < 0.0001). Statistical analyses were performed using ANOVA with Tukey’s test. (B) Quantification of CD4+Foxp3+ T cells (i.e., Treg cells) in B16F10 tumors by flow cytometry (gated on CD3+CD4+ T cells). (C) Immunohistochemical staining of B16F10 tumors showed Treg cells (Foxp3+) (brown) at 15 days of in vivo study. Scale bar, 100 μm. (D) Quantification of CD8+ T cells in B16F10 tumors analyzed by flow cytometry (gated on CD3+ T cells). (E) Immunofluorescence of B16F10 tumor sections showed infiltration of CD8+ T cells and expression of PD-L1 at 15 days of in vivo study. CD8+ T cells were labeled with Alexa Fluor 647 (purple fluorescence), PD-L1 was labeled with Alexa Fluor 488 (green fluorescence), and cell nuclei were labeled with DAPI (blue fluorescence). Scale bar, 50 μm.
