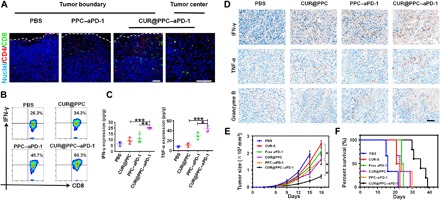
Fig. 6. In vivo immune response regulated by CUR@PPC–aPD-1 and antitumor therapeutic effect of nanodrug.

(A) Immunofluorescence of B16F10 tumor showed tumor infiltrations of CD8+ T cells and CD4+ T cells at 15 days of in vivo study schedule (see fig. S9A). CD8+ T cells were labeled with Alexa Fluor 488 (green fluorescence), CD4+ T cells were labeled with Alexa Fluor 555 (red fluorescence), and cell nuclei were labeled with DAPI (blue fluorescence). Scale bars, 100 μm. (B) Flow cytometry analysis of CD8+IFN-γ+ T cells in B16F10 tumors at 15 days of in vivo study (gated on CD3+CD4−CD8+ T cells). (C) The expression levels of interferon-γ (IFN-γ) and tumor necrosis factor–α (TNF-α) in B16F10 tumors of mice analyzed by ELISA assay at 15 days of in vivo study (n = 4; means ± SD; *P < 0.05, **P < 0.01, ***P < 0.001). Statistical analyses were performed using ANOVA with Tukey’s test. (D) Immunohistochemical staining of tumor-killing cytokines (IFN-γ, TNF-α, and granzyme B) (brown) in B16F10 tumor sections at 15 days of in vivo study. Scale bar, 50 μm. (E) Tumor growth and (F) cumulative survival of mice receiving different treatments (PBS, CUR-S, free aPD-1, CUR@PPC, PPC–aPD-1, and CUR@PPC–aPD-1) (n = 5; means ± SD; *P < 0.05, **P < 0.01). Statistical analyses in (E) were performed using ANOVA with Tukey’s test.
