Figure 3.
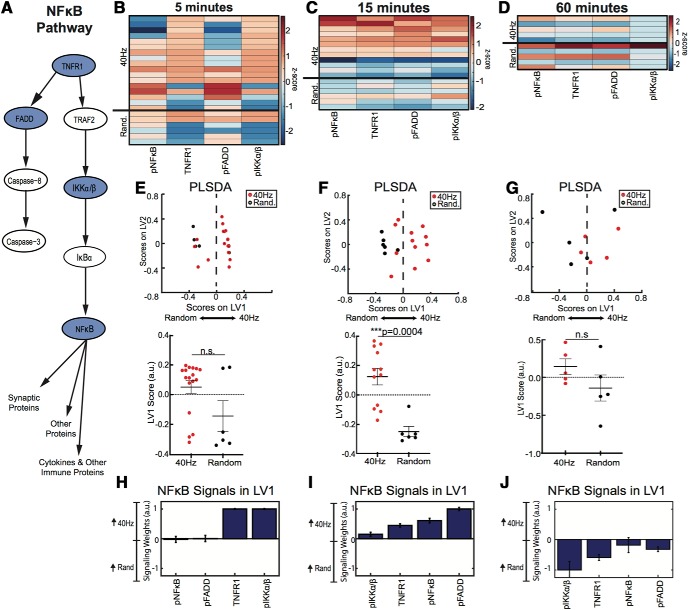
NF-κB phosphoprotein signaling in visual cortex increased in response to 15 min of 40 Hz flicker. A, Simplified diagram of NF-κB signaling including phosphoproteins quantified in the present study (blue ovals). B, NF-κB phosphoproteins quantified in visual cortex in mice exposed to 5 min of 40 Hz or random flicker (z scored). Each row represents one animal with groups separated by thicker black horizontal lines. Twenty-three total animals were analyzed, n = 17 in 40 Hz group, n = 6 in random group; outliers removed through a principle component analysis on the data and iterative removal of data points outside a 99.5% confidence ellipse (mahalanobisQC in R version 3.5.2). C, As in B for mice exposed to 15 min of 40 Hz or random flicker; 40 Hz, n = 12; random, n = 6. D, As in B for mice exposed to 60 min of 40 Hz or random flicker; 40 Hz, n = 6; random, n = 6. E, Top, PLSDA of phospho-signaling data from mice exposed to 5 min of flicker, separating 40 Hz (red)-exposed animal to the right and random (black) to the left, along LV1. Bottom, Plots of LV1 scores between groups show a trend toward higher LV1 scores in 40 Hz-exposed animals (difference between means ± SEM = −0.1943 ± 0.09455; t(21) = 2.065, p = 0.0525, two-tailed t test). Dots indicate individual animals for all graphs in this figure. F, Top, As in E for mice exposed to 15 min of 40 Hz or random flicker. Bottom, Plot of LV1 scores between groups reveals significantly higher LV1 scores in 40 Hz-exposed animals (difference between mean ± SEM values = −0.3721 ± 0.08351; t(16) = 4.456, p = 0.0004, two-tailed t test). Results were confirmed with permutation analysis (see Materials and Methods). G, Top, As in E for mice exposed to 60 min of 40 Hz or random flicker. Bottom, Plot of LV1 scores between groups shows no significant difference (difference between mean ± SEM values = −0.2829 ± 0.2; t(8) = 1.415, p = 0.1948, two-tailed t test). H, The weighted profile of NF-κB phosphoproteins that make up LV1 based on which phosphoproteins best correlated with 40 Hz (positive) or random (negative) after 5 min of flicker exposure (mean ± SD from a leave-one-out cross-validation). pIKKα/β and TNFR1 most strongly contributed to separation between the groups. I, As in H for 15 min of flicker. pFADD expression in 40 Hz flicker group and pNF-κB in random group most strongly contributed to separation between groups. J, As in H for 60 min of flicker.

