Figure 7.
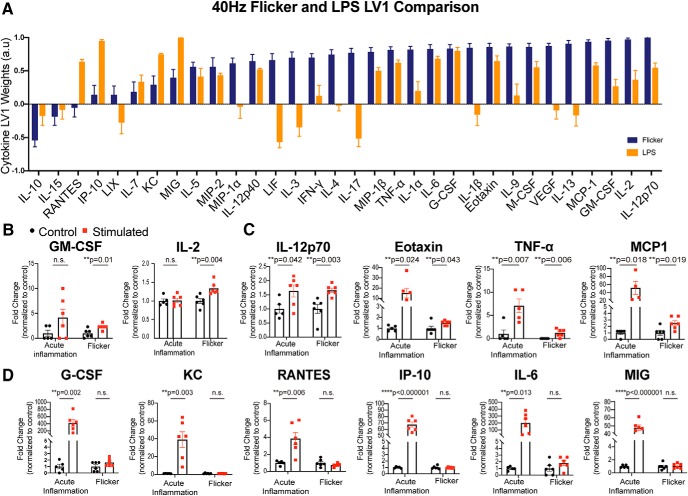
The 40 Hz flicker cytokine response differs from LPS-induced acute inflammation. A, The weighted profile of cytokines that make up LV1 following 40 Hz flicker (blue) or LPS (orange; mean ± SD from a leave-one-out cross-validation, N = 6). B, GM-CSF and IL-2 expression levels significantly differed in 40 Hz versus random (“Flicker”) but not LPS versus vehicle (“Acute Inflammation”). Error bars indicate the mean ± SEM. The p values for t test comparisons between groups are listed in the figure. C, IL-12p70, Eotaxin, TNF-α, and MCP1 expression levels significantly differed for both 40 Hz versus random and LPS versus vehicle. Error bars indicate the mean ± SEM. The p values for t test comparisons between groups are listed in figure. D, G-CSF, KC, RANTES, IP-10, IL-4, and MIC expression levels significantly differed for LPS versus vehicle but not for 40 Hz versus random flicker. Error bars indicate the mean ± SEM. The p values for t test comparisons between groups are listed in figure.

