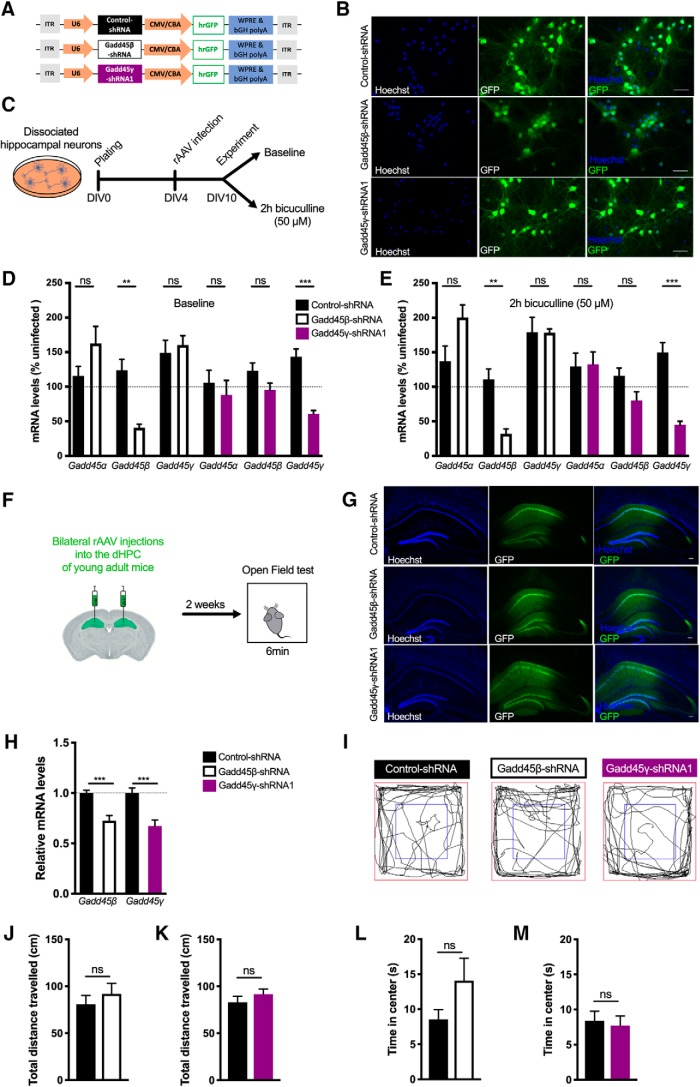
Figure 2.
Characterization of rAAV constructs for shRNA expression. A, Schematic representation of the viral constructs used. The viral vector contains a U6 promoter driving either Gadd45β-specific (Gadd45β–shRNA), Gadd45γ-specific (Gadd45γ–shRNA1), or control (control–shRNA) shRNA sequences and a cytomegalovirus (CMV)/chicken β-actin (CBA) hybrid promoter driving GFP as an infection marker. bGH polyA, Bovine growth hormone polyadenylation signal; ITR, inverted terminal repeat; WPRE, woodchuck hepatitis virus post-transcriptional regulatory element. B, Representative images of GFP+-cultured hippocampal cells infected with control–shRNA, Gadd45β–shRNA, or Gadd45γ–shRNA1. Scale bars, 40 μm. C, Schematic representation of the in vitro experimental design. D, E, qRT-PCR analysis of Gadd45α, Gadd45β, and Gadd45γ expression under baseline conditions (n = 3–5 independent neuronal cultures; D) or after 2 h bicuculline treatment (n = 3–4 independent neuronal cultures; E). Expression levels were normalized to the corresponding baseline or bicuculline-treated uninfected controls (dashed lines). **p < 0.01, ***p < 0.001 by two-tailed unpaired Student's t test. F, Schematic representation of the in vivo experimental design. G, Representative images of the dorsal hippocampus of control–shRNA, Gadd45β–shRNA, or Gadd45γ–shRNA1 groups 4 weeks after stereotaxic surgery. Scale bars, 100 μm. H, qRT-PCR analysis of Gadd45β and Gadd45γ expression in the dorsal hippocampus of Gadd45β–shRNA-injected mice (n = 8 mice) or Gadd45γ–shRNA1-injected mice (n = 9 mice) 30 min after object–location training normalized to control–shRNA [n = 9 or 10 mice (dashed line)]. I, Representative exploration traces of all groups during the open-field test. J, K, Locomotion analysis of control–shRNA (n = 11 mice) versus Gadd45β–shRNA groups (n = 12 mice; J) and control–shRNA (n = 14 mice) versus Gadd45γ–shRNA groups (n = 14 mice; K), quantified as the total distance traveled during the open-field test. L, M, Anxiety-like behavior, quantified as the percentage of time spent in the center of the arena during the open-field test of control–shRNA (n = 12 mice) versus Gadd45β–shRNA groups (n = 12 mice; L) and control–shRNA (n = 14 mice) versus Gadd45γ–shRNA groups (n = 14 mice; M). Two-tailed unpaired Student's t test. ns, Not significant. Error bars represent SEM.

