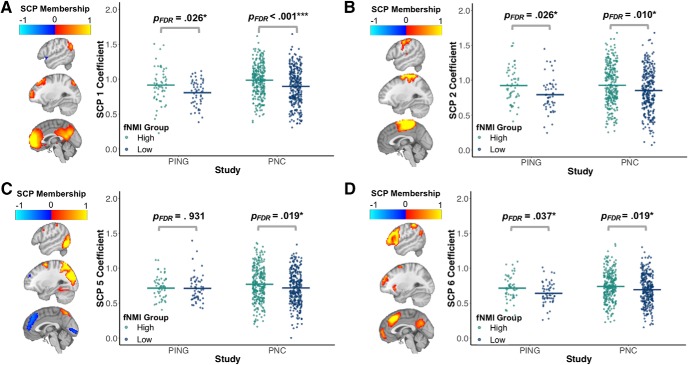
Figure 4.
Significant functional connectivity differences between the high and low fNMI groups in the PNC and PING cohorts. Four SCPs showed significant differences in connectivity between developmentally advanced and delayed groups. On the brain maps, red/yellow shading indicates correlated regions within the network, whereas blue shading indicates anti-correlated regions within the network. The segments on the jitterplot indicate the mean of each group. p values reflect the study-specific results of independent t tests between fNMI groups. There was relative consistency between the studies in the components that reflect the medial regions of the default mode network (A), the sensorimotor network (B), and the frontoparietal network (D). However, in the component that reflects the dorsal attention network (C), there were significant differences in the PNC, but not the PING cohort.

