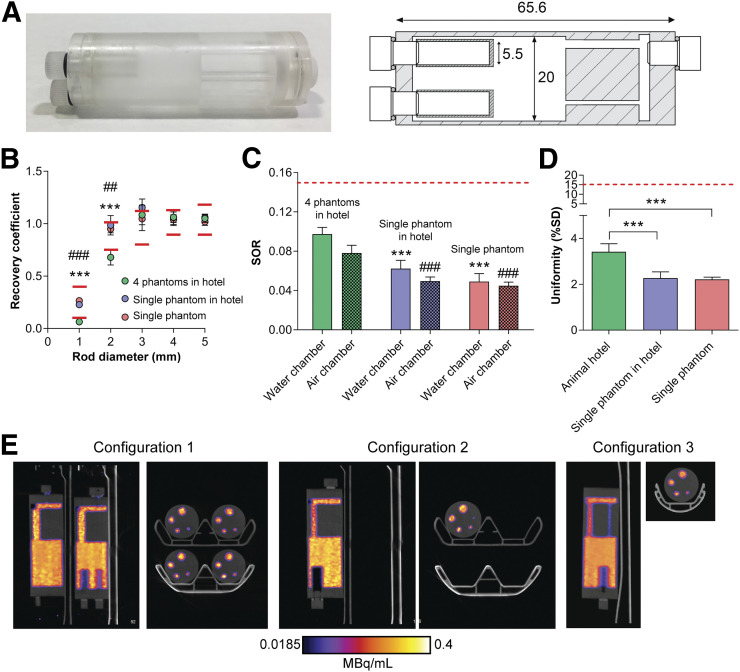
FIGURE 2.
(A) Photograph and diagram of mini image-quality NEMA NU-4 phantom, with dimensions shown in millimeters. (B–D) RC of 1- to 5-mm rods (B), SORs (C), and uniformity values (D) for phantoms imaged using mouse hotel. (E) Representative sagittal and axial PET images of 0- to 20-min summed activity. Solid and dashed red lines represent tolerable limits set by NEMA NU-4. In B: ***P < 0.001 for configuration 1 vs. 2; ###P < 0.001 for configuration 1 vs. 3. In C: ***P < 0.001 for configuration 1 water SOR vs. configurations 2 and 3; ###P < 0.001 for configuration 1 air SOR vs. configurations 2 and 3. ##P < 0.01 for configuration 1 vs 3. ***P < 0.001.

